Eleven observability startups, what each one actually does, how it charges, and where the catch is.
Most teams don't go looking for a new observability tool because something is missing. They go looking because the bill grew faster than the system it was watching. Every month there is more data, every month it costs more to keep, and at some point someone decides to keep less of it.
That is the gap these startups are going after. Some keep your data in your own cloud. Some change what the bill is counted in. A few are built for AI agents as much as for people. They all want to fix the same problem, but they go about it in very different ways. If you want the wider market as well, including Datadog and Grafana, read our guide to the best observability tools in 2026.
#1 CtrlB
An OpenTelemetry data lake on your own cloud storage.
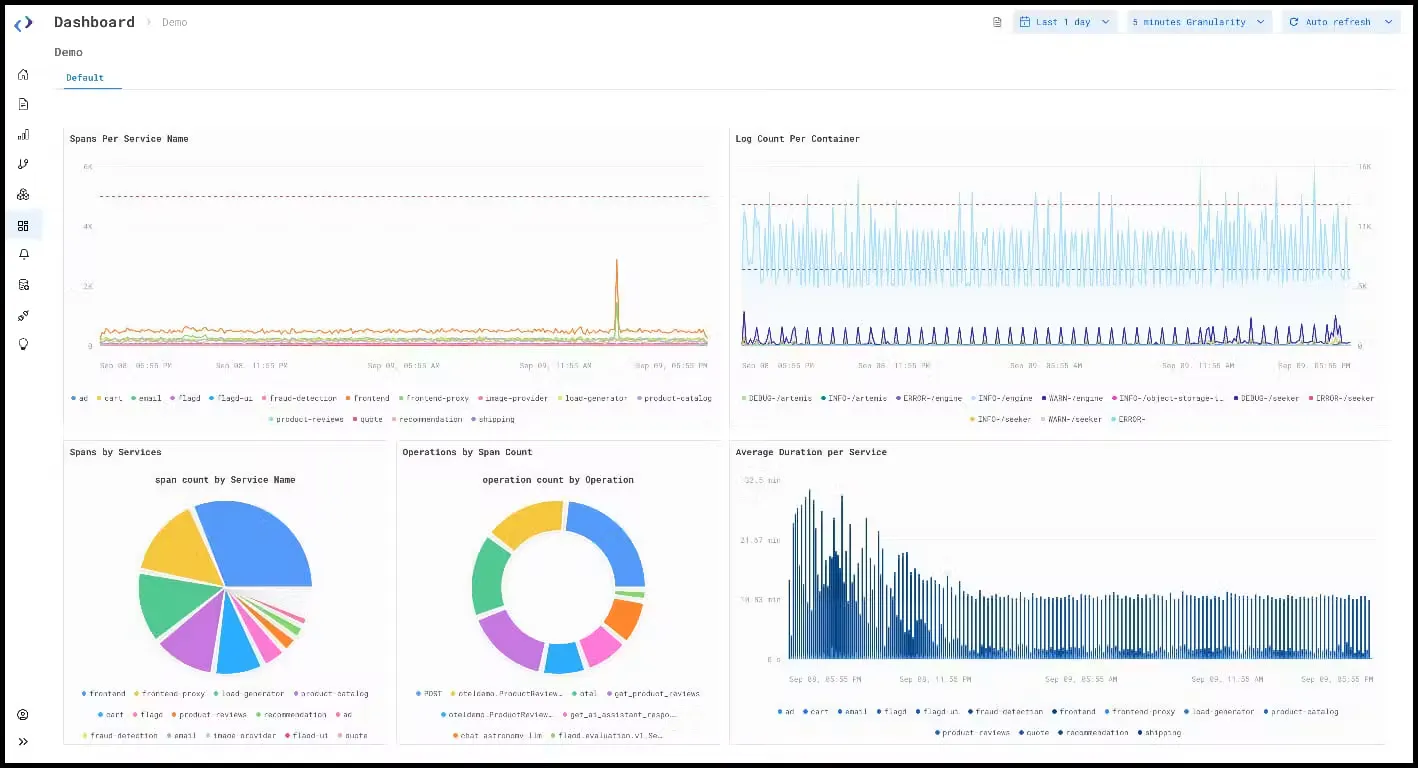
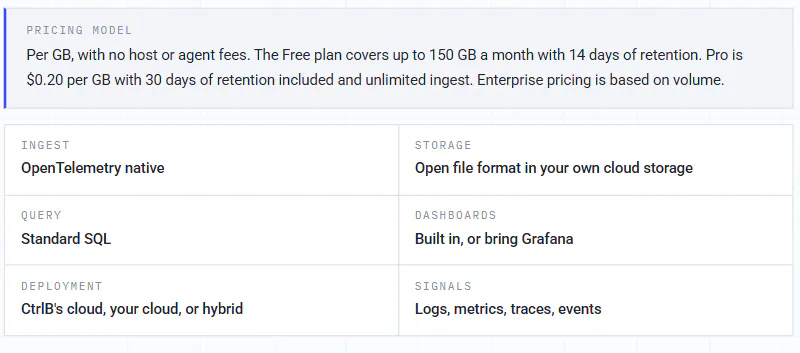
CtrlB is a data lake for telemetry, built for teams that have gone all in on OpenTelemetry. Most platforms keep your data in storage they own, which you pay for every month and cannot read without them. CtrlB flips that. Logs, metrics, traces and events are written into your own cloud storage in an open file format, and you search all of it with SQL, the language most engineers already know. Dashboards are built in, and if your team already lives in Grafana, plug that in on top. CtrlB runs in its own cloud, in yours, or as a hybrid of the two.
WHAT'S GOOD
- Keeping data for longer stops being a budget decision. Most platforms copy your data into a search index, and that index is what you rent. CtrlB keeps everything in ordinary cloud storage instead, which is far cheaper, so a full history costs up to 90% less than the same data on an index-based platform. No sampling, no tiers, no quarterly negotiation about how much of last month you can afford to keep.
- One place to look, one language to ask in. Searching raw log text and running the bigger number-crunching queries happen on the same data, in standard SQL. There is no second language for logs, no third one for traces, and no separate system you have to copy data into first.
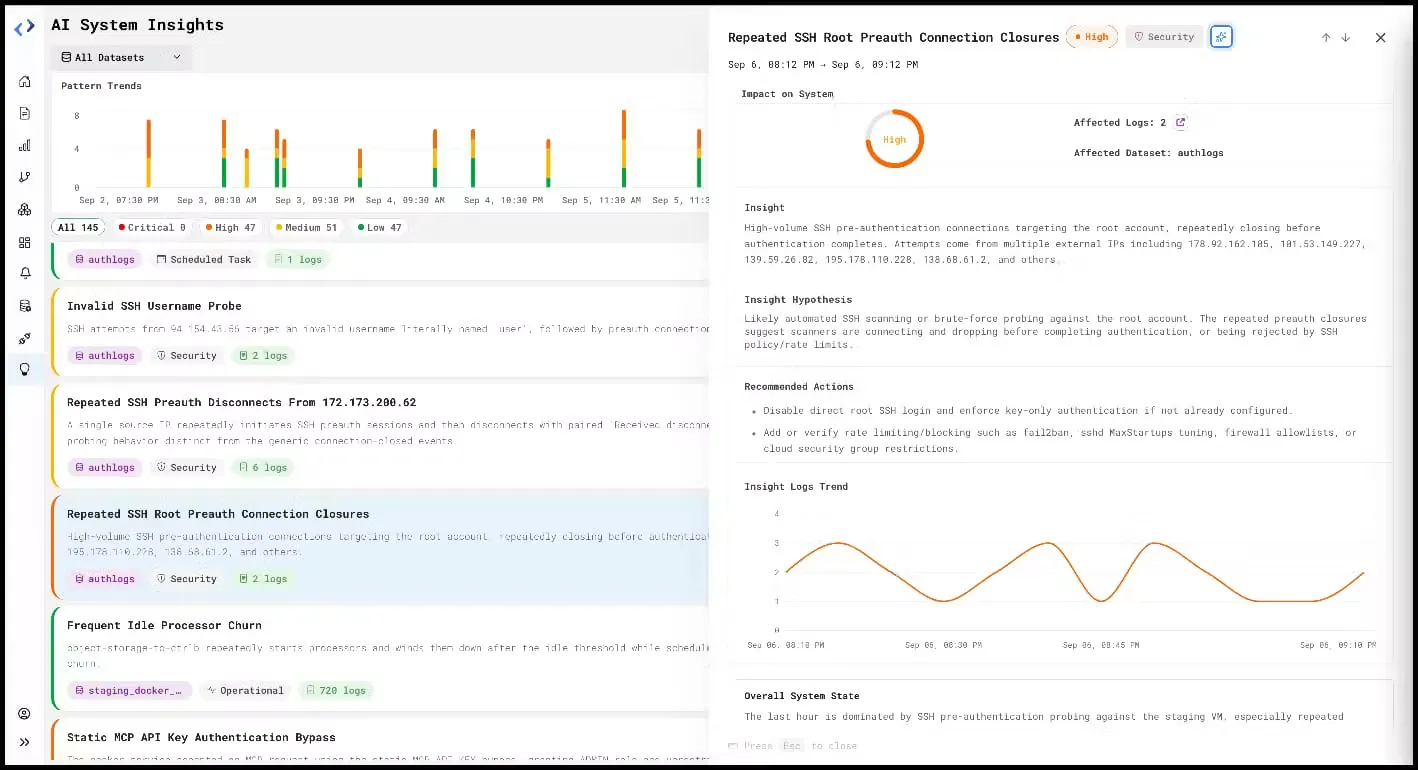
- The Insight Engine reads your data so you do not have to. It runs all the time, groups millions of near-identical log lines into a handful of patterns, and flags the odd ones: the rare event, the new error, the thing nobody wrote an alert for. Each finding comes with how serious it is, the data behind it, a plain explanation of what it thinks happened, and what to do next. You are not staring at an empty search box at two in the morning.
THE TRADE-OFF
- Younger than the big suites. CtrlB ships fast, but a product that has been around for over a decade will still have a few extra boxes ticked on the feature checklist.

#2 groundcover
eBPF monitoring for Kubernetes that runs in your own cloud.
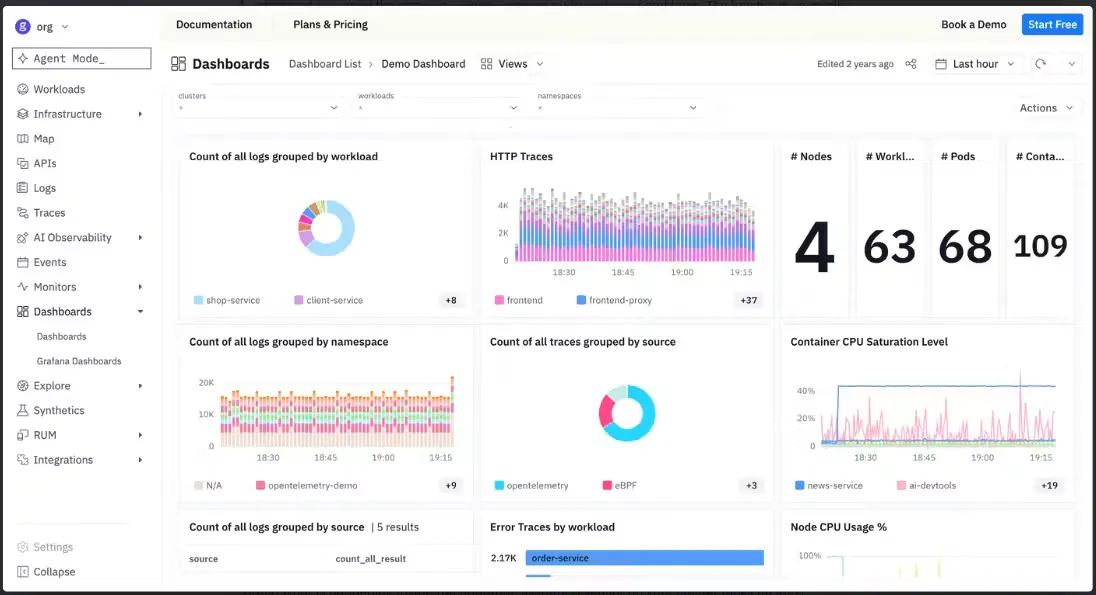
Groundcover is a monitoring platform for Kubernetes built on eBPF, a Linux feature that lets software watch what is happening inside the operating system. A sensor on your cluster picks up logs, metrics, traces and application performance data without anyone touching application code, and the backend runs inside your own cloud.

WHAT'S GOOD
- Your data stays home. The backend runs in your own cloud account, and groundcover only runs the control side and the interface. When compliance asks where the logs live, you have a one-line answer.
- No code changes. The eBPF sensor watches traffic from inside the operating system, so nobody has to add libraries to every service or redeploy anything.
- More data, same bill. You pay per host, so sending more telemetry doesn't push the price up.
THE TRADE-OFF
- Kubernetes, on their sensor. The no-code trick depends on groundcover's own eBPF sensor running on every node. It accepts OpenTelemetry data too, but outside Kubernetes it gets thin: on plain Linux servers it only traces apps running in Docker.
- Two bills, not one. The per-host price covers groundcover. The servers and storage behind it run in your cloud account, so they show up on your cloud invoice as well.

#3 Coralogix
In-stream analysis with logs routed into three storage tiers.
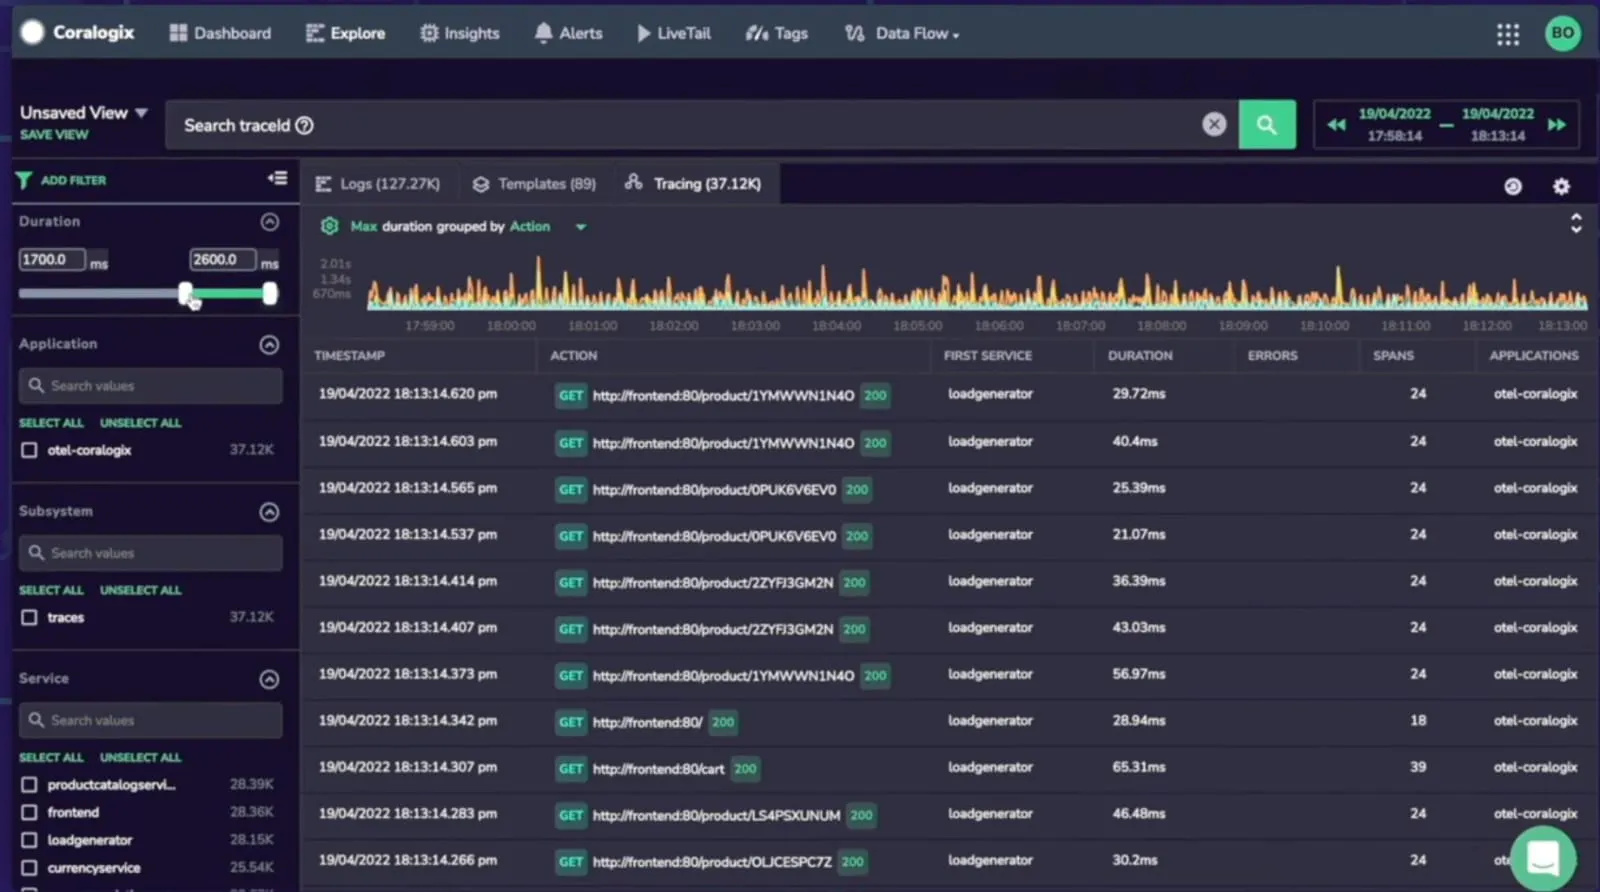
Coralogix covers logs, metrics and traces. It analyses data as it streams in, before anything is indexed, so alerts can fire sooner. After that, you route each kind of log into one of three tiers. Frequent Search stays in Coralogix's hot storage, while Monitoring and Compliance keep the raw data in an S3 bucket you own.

WHAT'S GOOD
- One price, everything included. You pay per GB and that's it. SSO, RBAC and 24/7 support come with every account, with no charge per user or per host.
- Alerts fire before indexing. Coralogix reads data while it streams in, so an alert can go off before the log is even indexed.
- Your archive, your bucket. Logs and traces in the two cheaper tiers land in your own S3 as Parquet files, and searching them from Coralogix doesn't eat into your quota.
THE TRADE-OFF
- You sort every log up front. Each log has to be routed to a tier, and anything you forget lands in Frequent Search, the most expensive one. The cheapest tier is cheap for a reason: no alerts and no custom dashboards.
- Go over the quota and data stops. Every account has a daily limit. Without pay-as-you-go switched on, anything past it is blocked until midnight UTC.
- A language you'll only use here. Logs and traces are queried in DataPrime, Coralogix's own piped language, with PromQL for metrics, so the queries you write don't carry over to other tools.

#4 OpenObserve
Open source observability with Parquet storage and SQL.
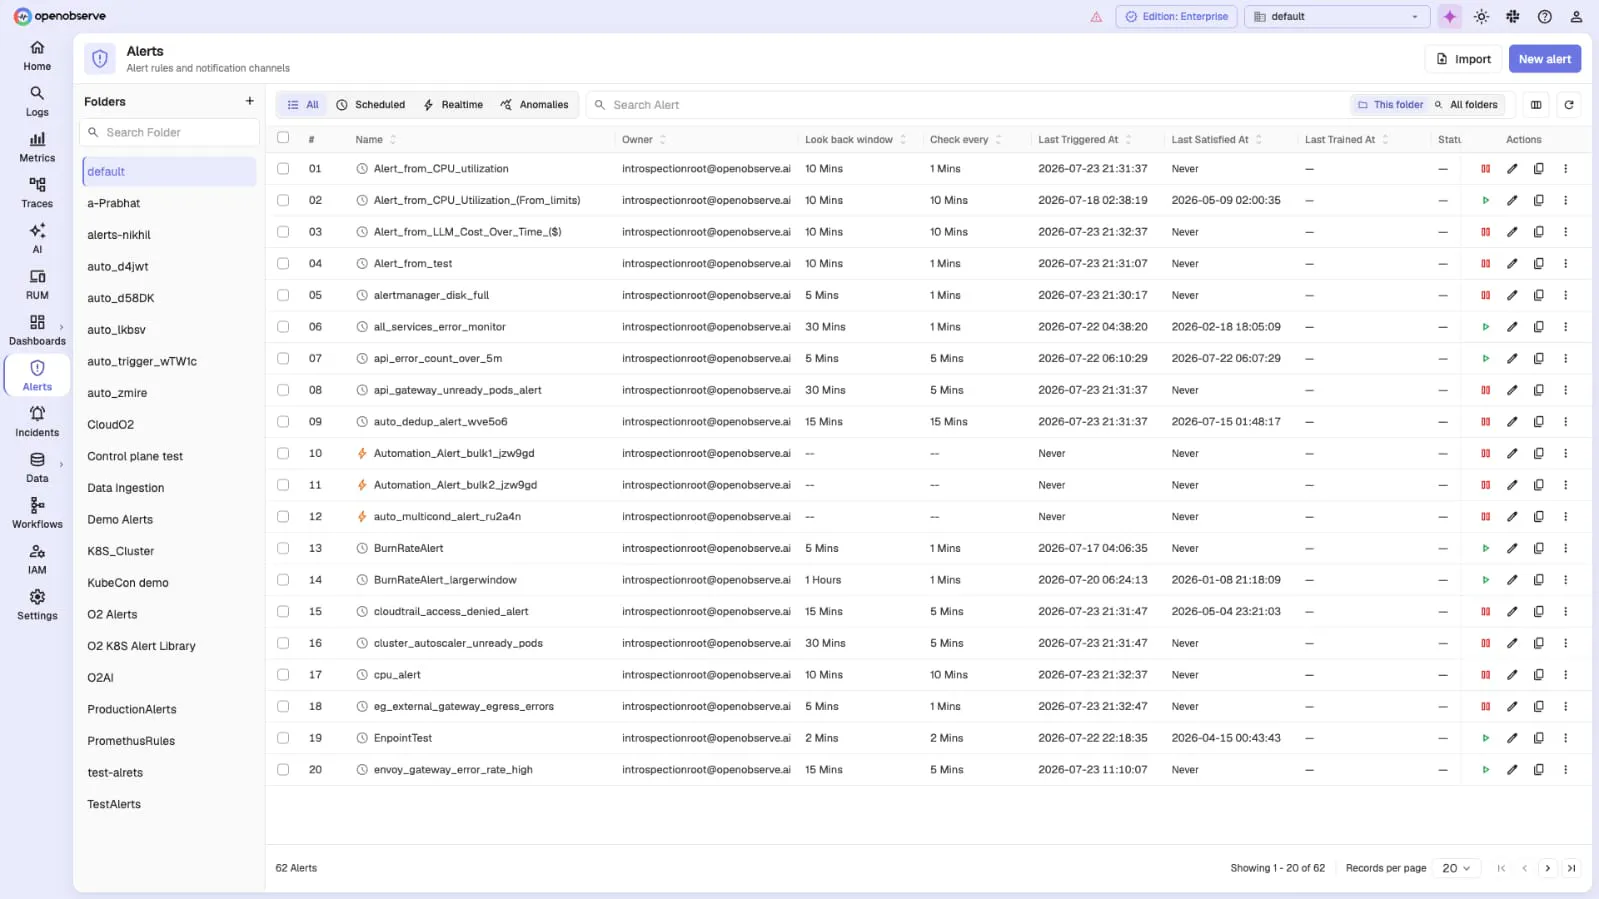
OpenObserve is an open source platform that covers logs, metrics, traces, real user monitoring and LLM observability in one place. It ships as a single binary, stores data as Parquet files on S3-style object storage, and you query it with SQL, with PromQL there for metrics if you want it. You can run it yourself or use OpenObserve Cloud. OpenObserve says more than 8,000 organisations run the open source project.

WHAT'S GOOD
- SQL, not a new language. Logs and traces are queried in SQL, and metrics in SQL or PromQL. Your team already knows how to ask.
- Free up to 50 GB a day. The self-hosted Enterprise tier costs nothing below that line, and it includes SSO and RBAC.
- One thing to run. It's a single binary, so there's no pile of services to stitch together before day one.
THE TRADE-OFF
- Open source, with strings attached. The free edition is licensed under AGPL-3.0, which matters if you build it into your own product, and SSO isn't in it at all.
- Searching costs extra in the cloud. Every GB you query is billed on top of what you ingest, so a long week of debugging shows up on the invoice.
- Deletes are all or nothing. You can remove a whole stream or a window of time, but not one record. Fine for cleanup, awkward when someone asks you to delete one user's data.

#5 Axiom
Fully managed storage for logs, events and traces.
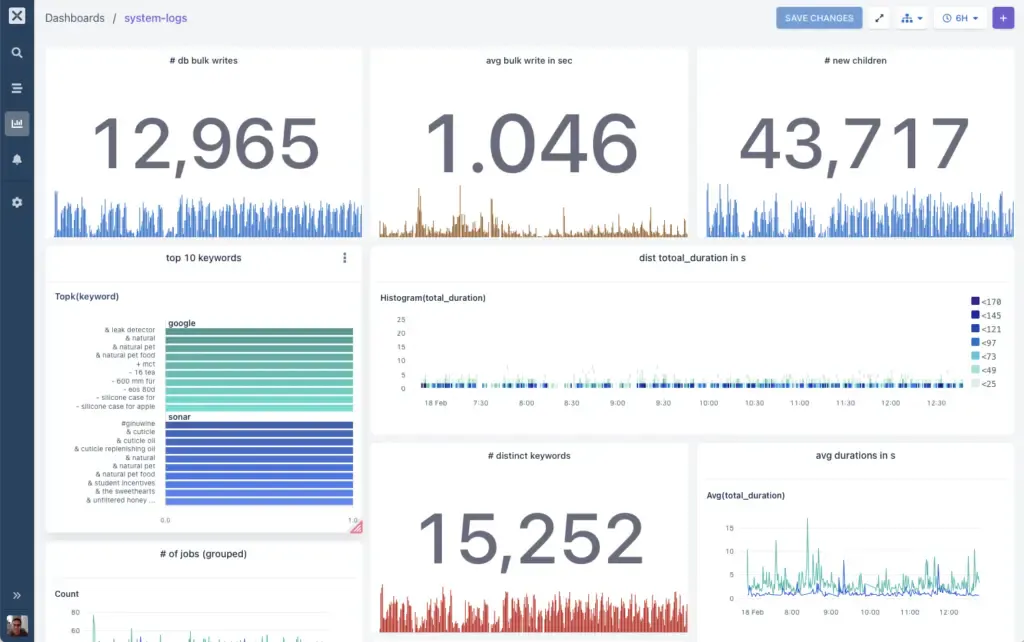
Axiom is a fully managed home for event and telemetry data, used for logs, metrics, traces and events. You don't plan a schema first, because fields are read at query time, and the data sits in object storage in Axiom's cloud. Queries are written in APL, or MPL for metrics, and both plans come with an MCP server so AI agents can query it too.

WHAT'S GOOD
- A generous free plan. Personal gives you 500 GB of data loading a month, plus 10 GB-hours of query compute and 25 GB of storage.
- Spend caps that actually cap. Set spend alerts and hard limits, so a noisy deploy can't surprise you at the end of the month.
- MCP in the box. AI agents can query Axiom through its MCP server on both plans, with no add-on to buy.
THE TRADE-OFF
- Every search runs a meter. Loading data and querying it are billed separately, with query compute charged per GB-hour. The harder you dig during an incident, the more it costs.
- Their cloud, their languages. There's no version that runs in your own account, queries use APL and MPL, which only Axiom speaks, and SSO ($100 a month) and RBAC ($50 a month) cost extra.

#6 Coroot
Open source eBPF monitoring that explains its alerts.
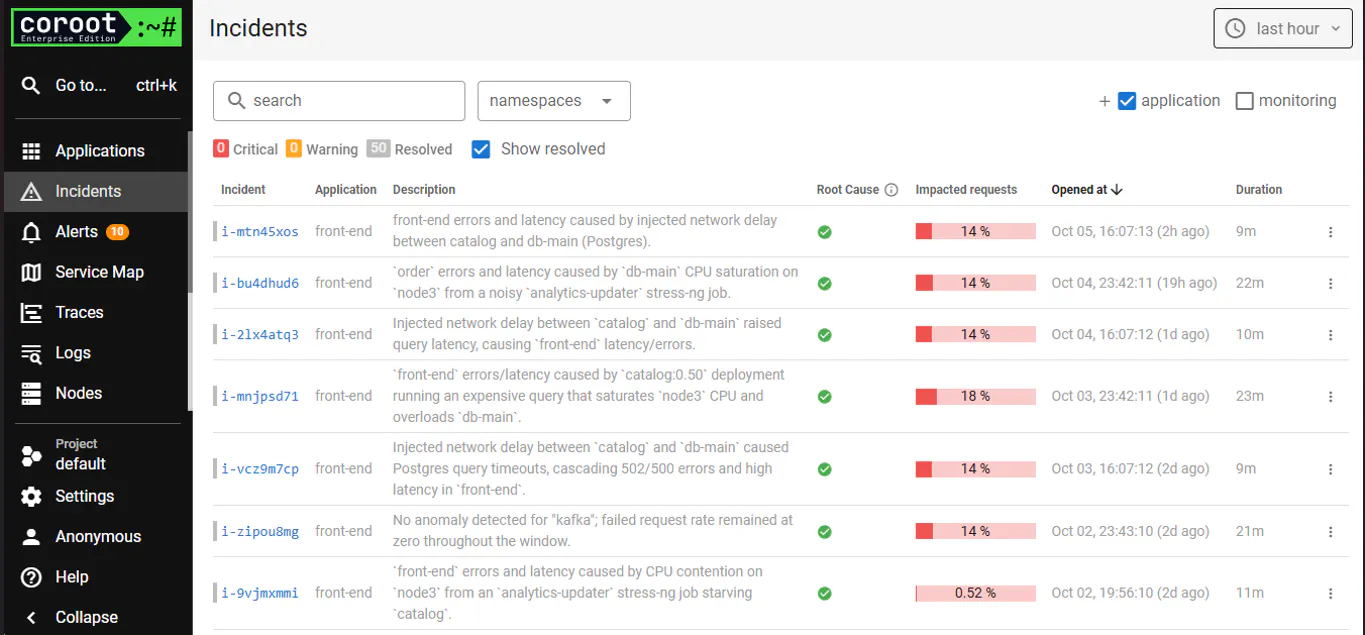
Coroot is open source and uses its own eBPF agent to collect metrics, logs, traces and profiles without any changes to your code. It comes with a wide set of predefined inspections and dashboards, and when an SLO is broken, the alert already includes the results of every relevant inspection. The Coroot agent now runs on Windows as well.

WHAT'S GOOD
- Alerts that come with answers. When an SLO breaks, you get one alert with the results of every relevant check already attached, so you start from a likely cause instead of ten separate alarms.
- Free and properly open. The Community Edition is Apache 2.0 with no limit on what you monitor, and connecting it to Coroot Cloud adds 10 AI root cause investigations a month.
- Cheap when you pay. $1 per monitored CPU core a month, so 40 cores cost $40.
THE TRADE-OFF
- You're running ClickHouse now. Coroot stores logs, traces and profiles in ClickHouse, and that database is yours to operate, upgrade and size. It also keeps its own schema, so it won't read OpenTelemetry data another tool already stored there.
- Login controls cost extra. Single sign-on and custom roles are only in the paid Enterprise edition.

#7 Cardinal
An observability data lake built for AI coding agents.
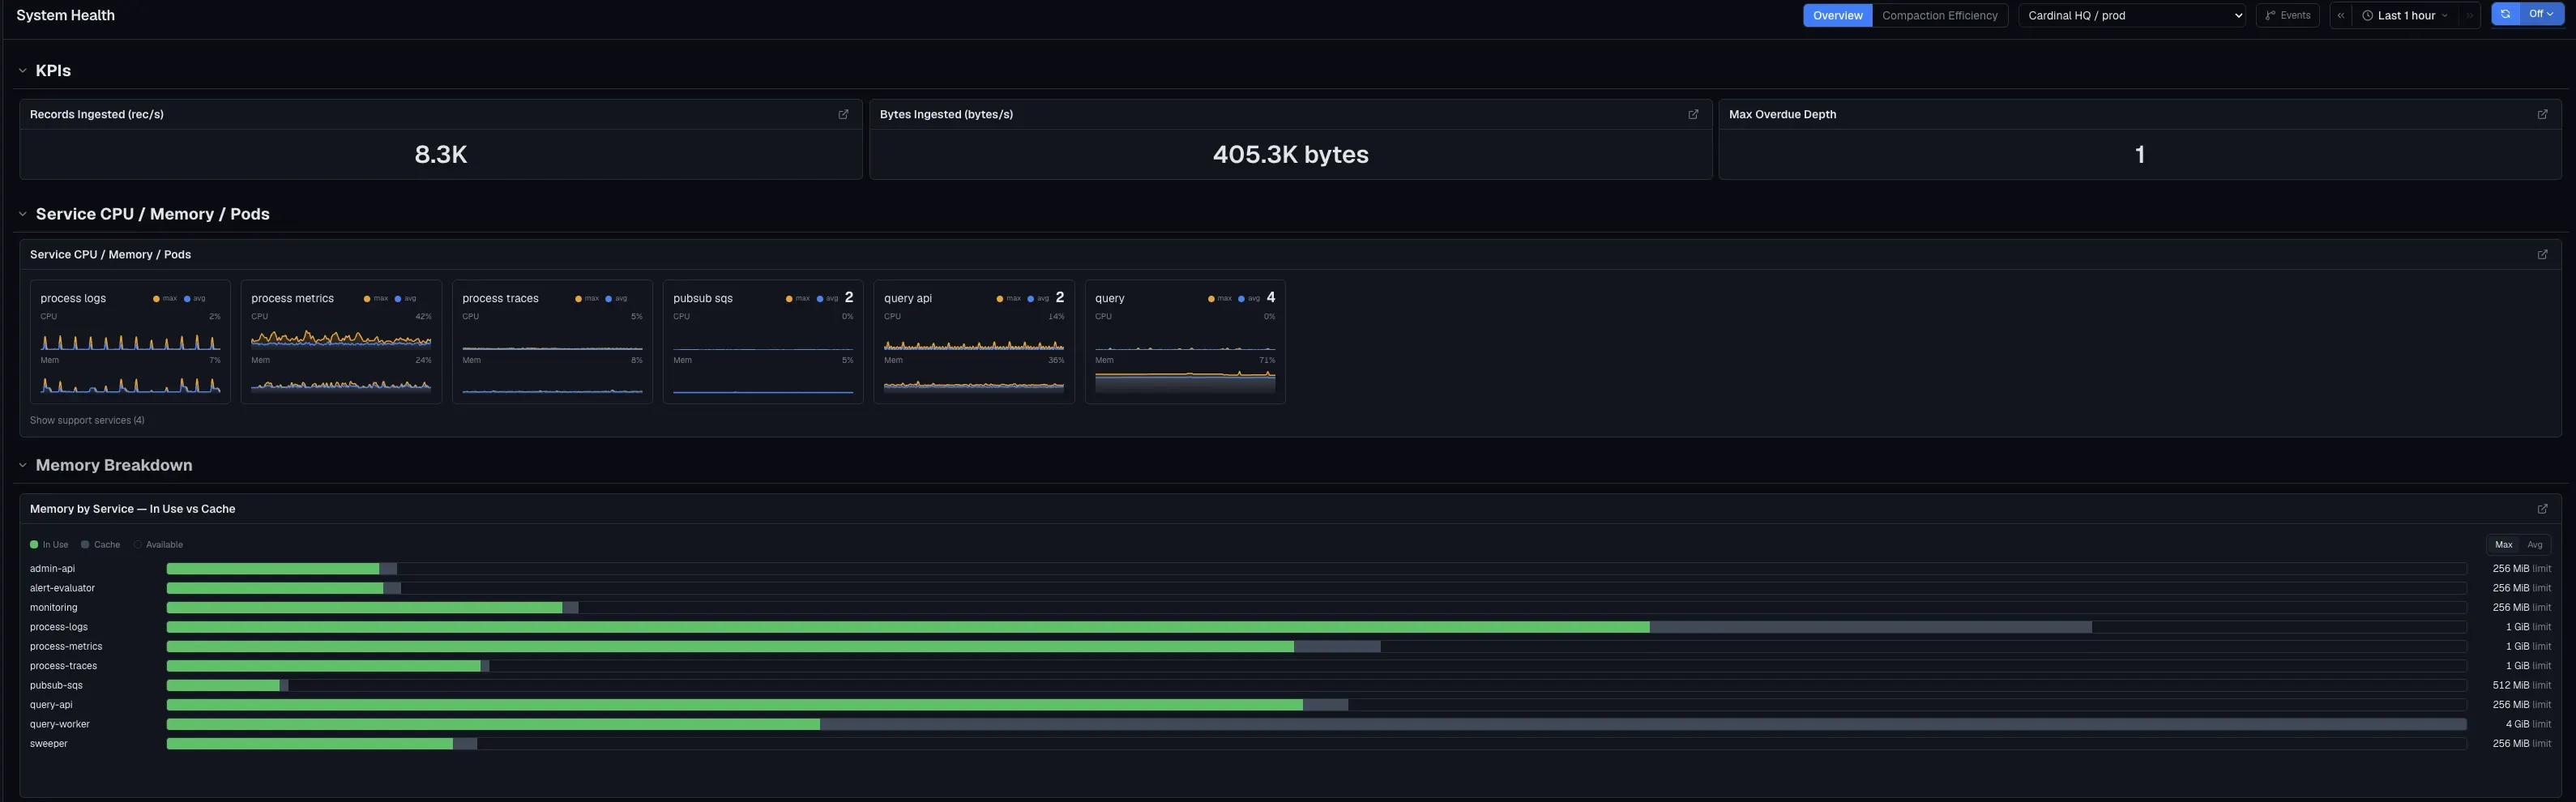
Cardinal calls itself a full-fidelity observability data lake built for machine-scale investigation. OpenTelemetry sends logs, metrics and traces into your own object store on AWS, Google Cloud or Azure, or you can let Cardinal run it in its cloud. Its CEO, Ruchir Jha, led Netflix's Observability Platform Team for seven years.

WHAT'S GOOD
- Made for coding agents. Claude Code, Codex, Cursor and Gemini CLI query it directly, and a finished investigation can be saved as a Sentinel, a reusable workflow the next agent can pick up.
- Send as much as you like. In your own cloud there's no charge for data volume or compute. The price follows the support tier you pick.
- Your data in your storage. Run it in your own cloud and the telemetry stays in your own object store.
THE TRADE-OFF
- A big ticket to get in. After the evaluation, Standard is $7,000 a month, and Cardinal's own calculator adds about $1,356 a month in cloud costs at 100 GB a day with 90-day retention.
- A format only Cardinal reads. Cardinal swapped Parquet for its own LKRN format, and queries are PromQL and LogQL only, with no SQL.

#8 base14
Per-signal pricing with reliability help included.
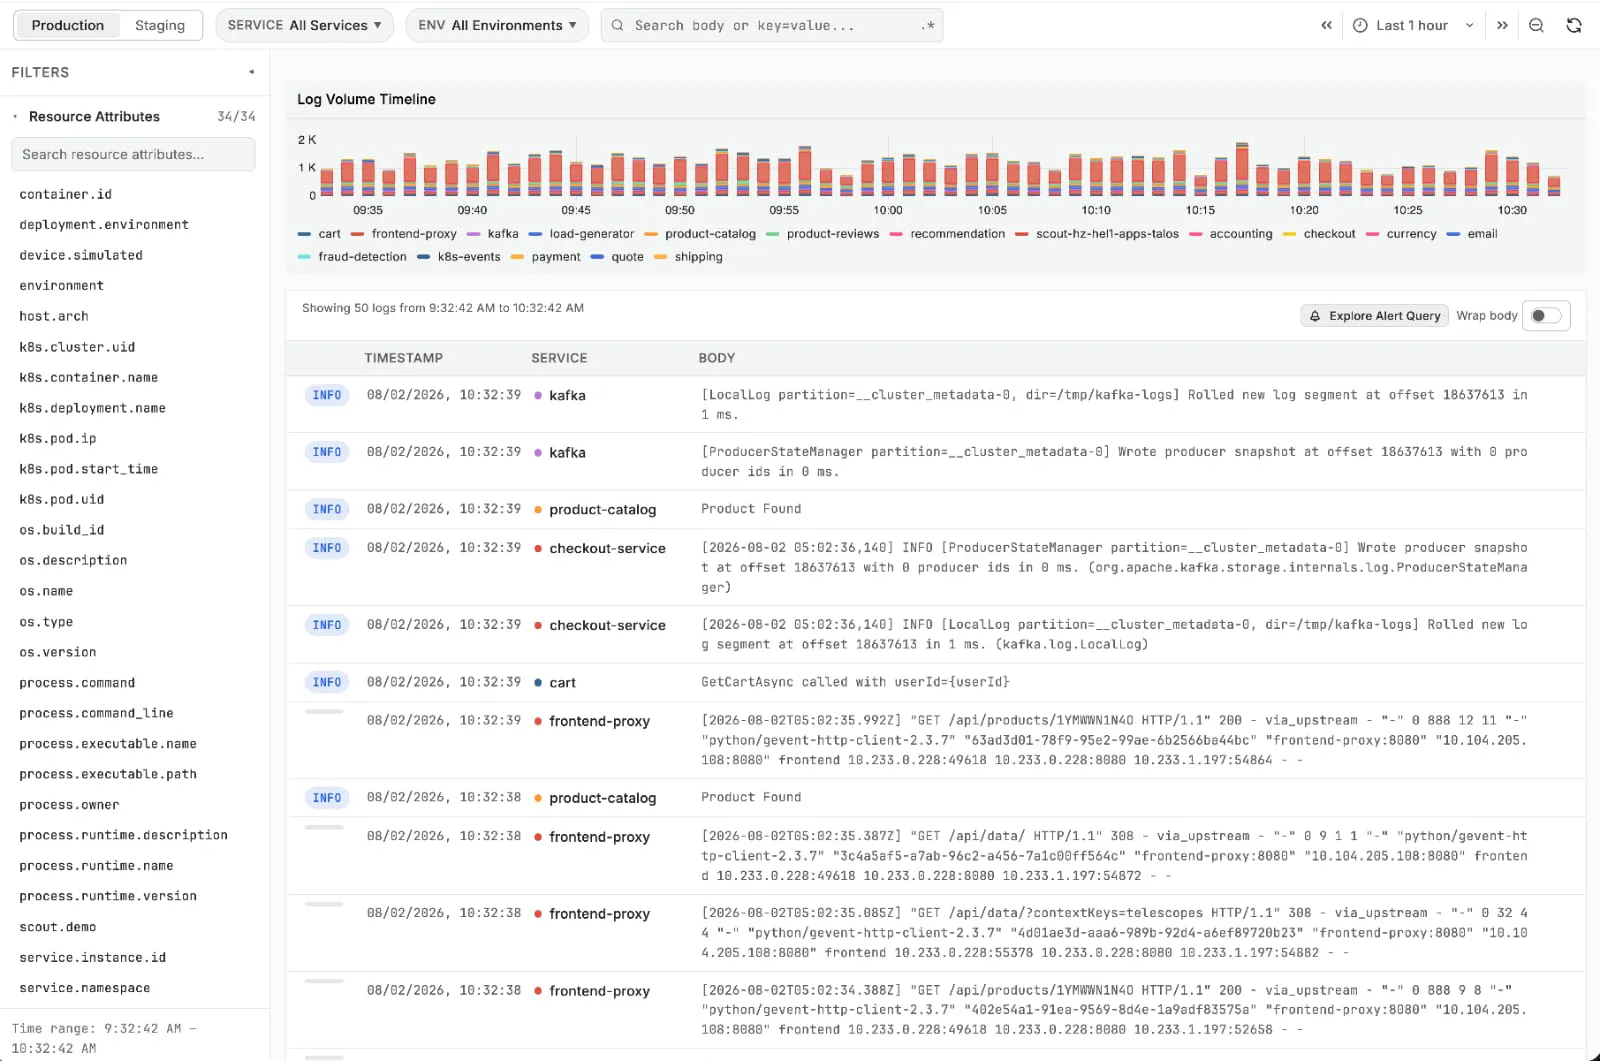
base14's product, Scout, brings logs, metrics, traces, APM and LLM observability into one platform. It's built on OpenTelemetry and you query it with SQL. Data stays hot at full resolution for 30 days, and after that you can bring your own S3-compatible bucket and keep it as long as you like.

WHAT'S GOOD
- Big log lines, same price. Every log, metric or trace span counts as one signal, however large it is.
- Humans included. The Startup plan comes with dedicated Slack support, onboarding help and a reliability review every two weeks.
- No seat fees. Add as many people as the plan allows without adding to the bill.
THE TRADE-OFF
- The good stuff is on Enterprise. Running it in your own cloud, SSO and real user monitoring all need the Enterprise plan.
- Startup has a ceiling. It stops at 50 users, 50 dashboards and 100 alerts, and apps that write lots of tiny logs burn through signals faster than you'd expect.

#9 Dash0
A hosted OpenTelemetry platform with PromQL.
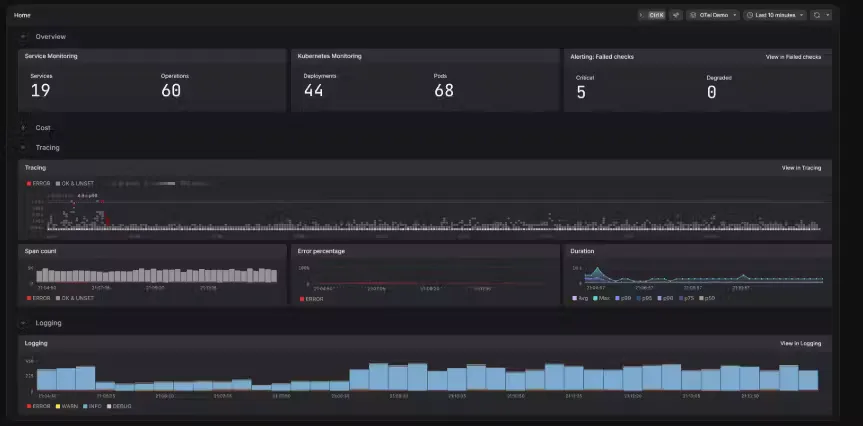
Dash0 is a hosted platform built around OpenTelemetry, aimed at teams running modern cloud systems. It takes standard OTLP data directly, lets you query it with PromQL or SQL, and bills per signal rather than per person.

WHAT'S GOOD
- Easy to leave, which is the point. Queries, dashboards and collector settings are all in open formats, so you could pack up and go without rewriting everything.
- Open standards all the way down. Query in PromQL or SQL, send plain OpenTelemetry with no Dash0 agent to install, and let the Agent0 assistants dig into root causes for you.
THE TRADE-OFF
- Their cloud, not yours. Dash0 runs the platform for you, and its pricing page lists no plan that puts the backend in your own account. If your data has to stay put, check with them before you commit.
- Two meters per signal. Every span, log and metric data point is billed once to ingest and again to store, and Agent0 runs on credits on top.

#10 SigNoz
Open source, OpenTelemetry-native observability on ClickHouse.
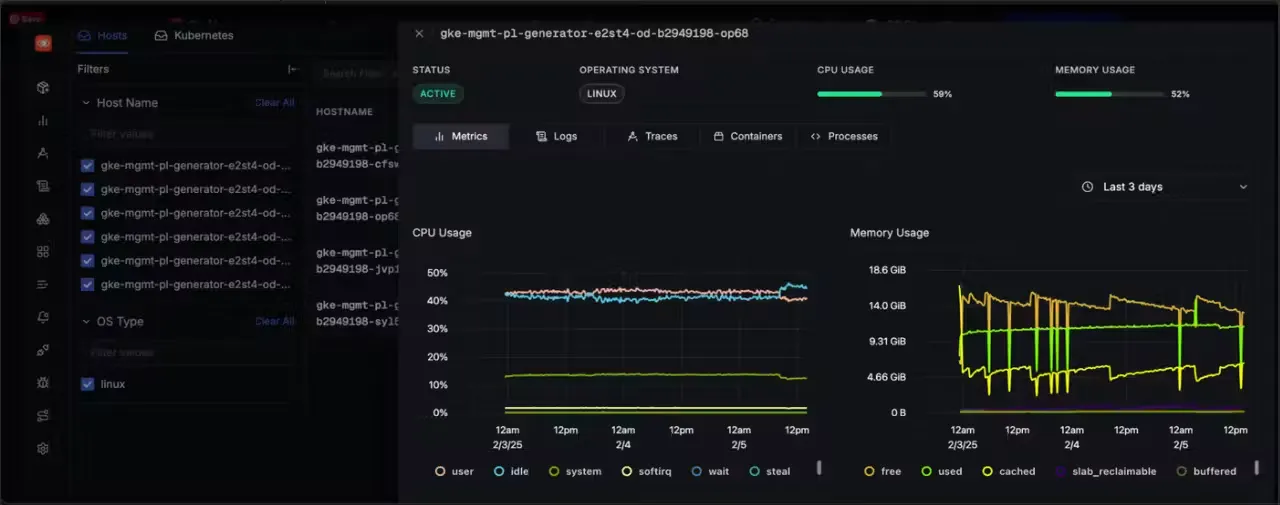
SigNoz is an open source platform built around OpenTelemetry from day one. Logs, metrics and traces sit together in one app on top of ClickHouse, a database designed for fast analysis of large datasets. Run it yourself or use their hosted version.

WHAT'S GOOD
- OpenTelemetry from day one. OpenTelemetry's conventions are kept as they are rather than translated into something else, and the whole thing can run inside your own environment.
- All three signals, one app. Logs, metrics and traces link up without you wiring anything together.
THE TRADE-OFF
- Self-hosting means owning ClickHouse. Upgrades, capacity planning and retention at your volume are all your team's job, and that gets heavier as the data grows.
- Three ways to ask one question. A visual query builder, PromQL and ClickHouse SQL all live side by side, so check in a trial which one your team actually ends up using.

#11 Honeycomb
Event-based debugging for high-cardinality data.
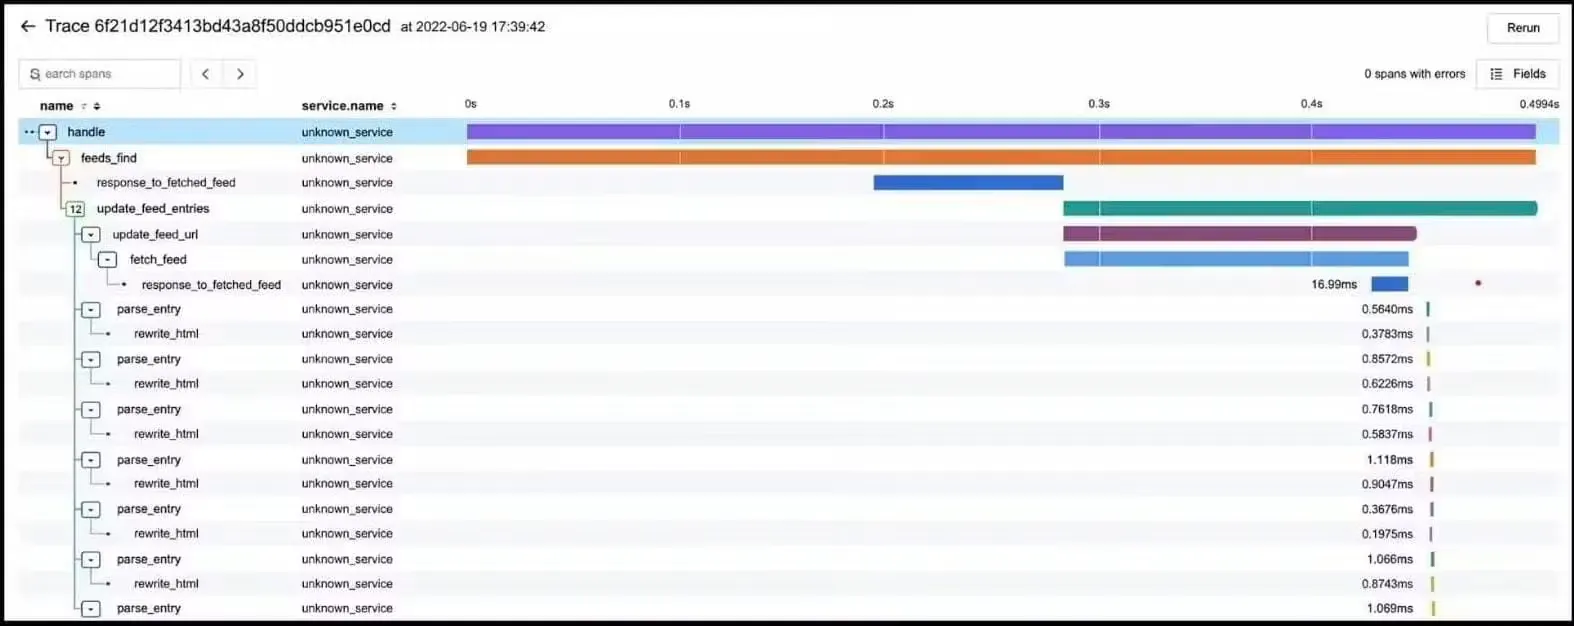
Honeycomb was built for investigating complicated systems. It stores rich events rather than plain log lines, and it copes well with fields that have huge numbers of possible values, such as a customer ID. It exists for the questions nobody planned for, which is usually where you are when something breaks in a way no dashboard predicted.
WHAT'S GOOD
- Great at "why is this request weird?" Break the data down by any field, even customer ID, and outlier analysis shows what the slow or failing requests have in common.
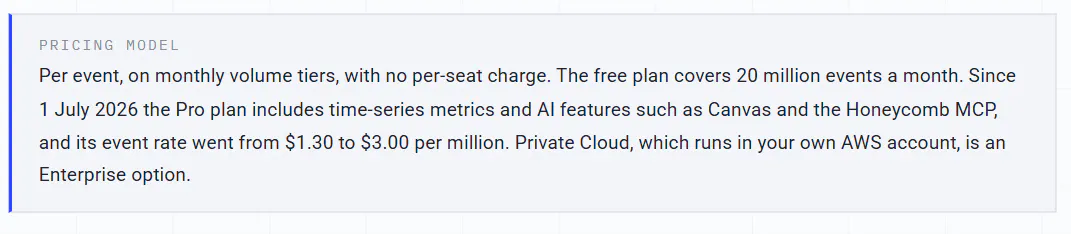
- Metrics and AI now in the plan. Since July 2026, Pro bundles time-series metrics, Canvas and the Honeycomb MCP, so AI coding tools can investigate directly.
THE TRADE-OFF
- The bundle costs more. The Pro event rate more than doubled, from $1.30 to $3.00 per million events.
- Rarely your only tool. Server dashboards and broad infrastructure monitoring aren't its strength, and its way of modelling data takes a while to click, so it usually runs next to something else.

Where the bill went
Every startup on this list is chasing the same problem: an observability bill that grows faster than the systems it watches. They just disagree on where the cost should go.
groundcover moves it to a per-host price plus a backend in your cloud. Coralogix turns it into routing rules you have to get right up front. Axiom and OpenObserve Cloud put a meter on every search. Cardinal's own-cloud plans start at $7,000 a month once the free evaluation ends, Coroot and self-hosted SigNoz hand you a ClickHouse cluster to babysit, and base14, Dash0 and Honeycomb count signals or events instead of gigabytes. In most cases the bill didn't go away. It just moved somewhere else.
CtrlB takes the most direct route. Your telemetry sits in your own cloud storage in an open format, you search all of it with SQL, there's no vendor agent to install and no tiers to sort logs into, and the pricing page puts the saving at up to 90%. You keep the history, you own the data, and the bill is a simple price per GB.
If you already run OpenTelemetry, test it the simple way. Point one collector at CtrlB, keep everything for a month, and compare the search times and the invoice with what you run today. Check out the live playground to try it first, and since the free plan covers up to 150 GB a month, the first look costs nothing. Try it for free or book a demo.