Ten platforms, what each one is actually good at, what it costs, and who it suits. Written for teams who have settled on OpenTelemetry for collecting their data and are now deciding where that data should live.
Getting data out of your systems is almost a solved problem. OpenTelemetry is the standard now for collecting logs, metrics and traces, almost every platform here takes it directly and changing the piece that collects your data is no longer the hard part of moving. What continues to set these tools apart is what happens next: where the data is stored, how fast you can search it, what it costs to keep it for long enough to be useful.
That is usually where the decision actually gets made. Nobody replaces a platform because a dashboard was ugly. They replace it because holding on to the data got expensive, so they started keeping only some of it, and then something broke in a week they had already thrown away.
#1 CtrlB
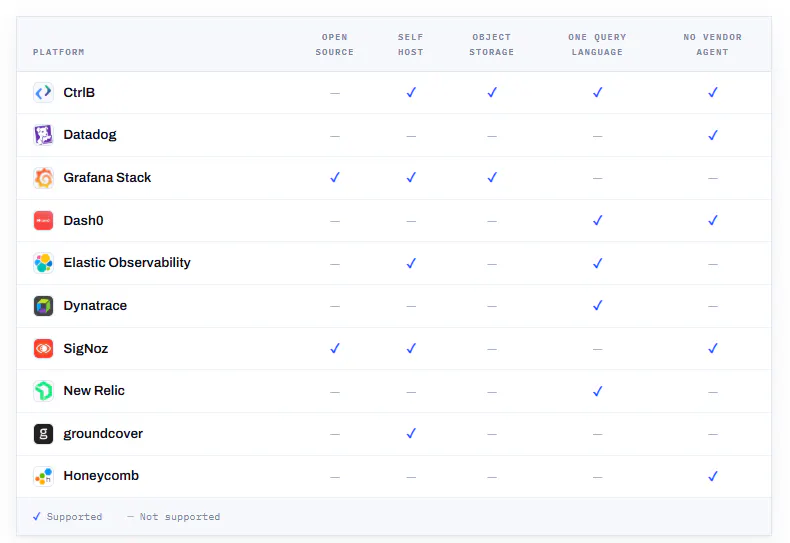
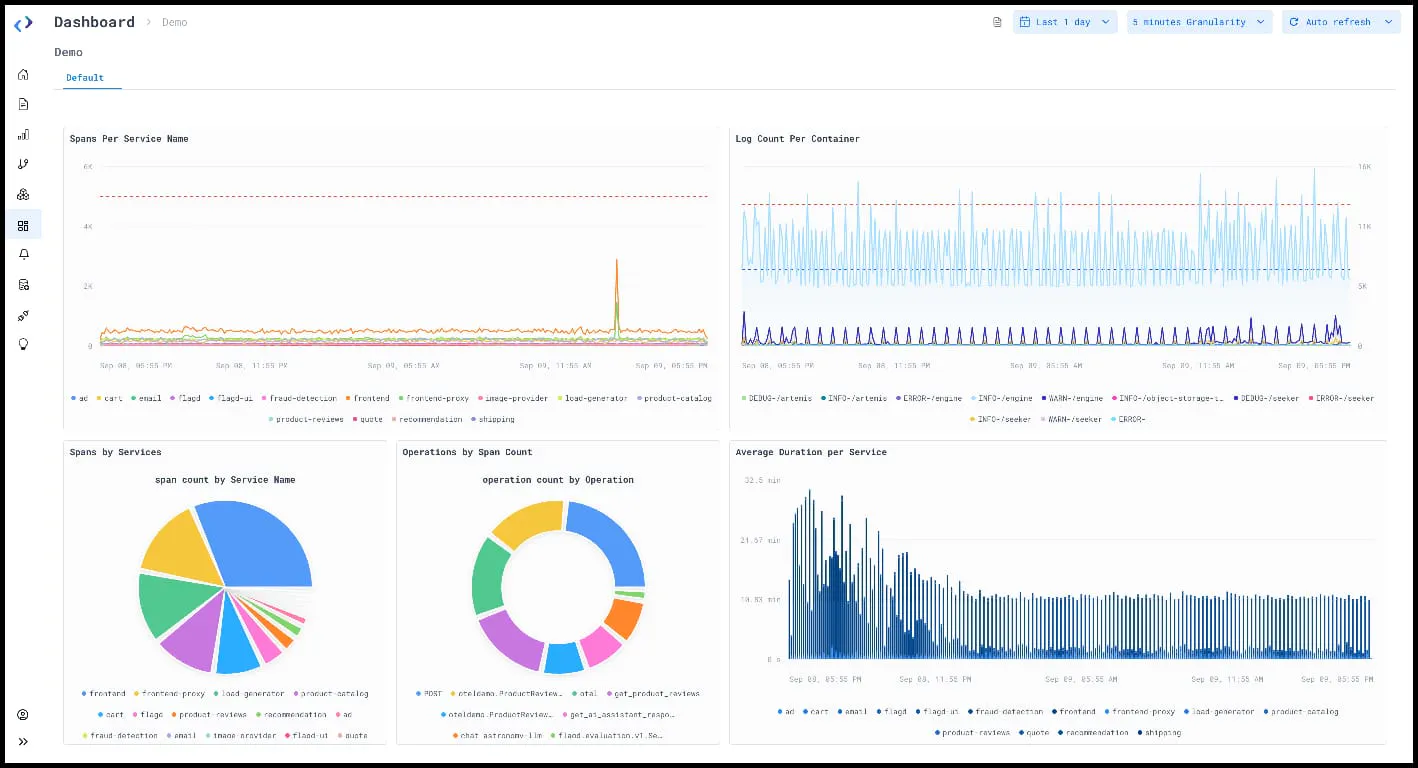
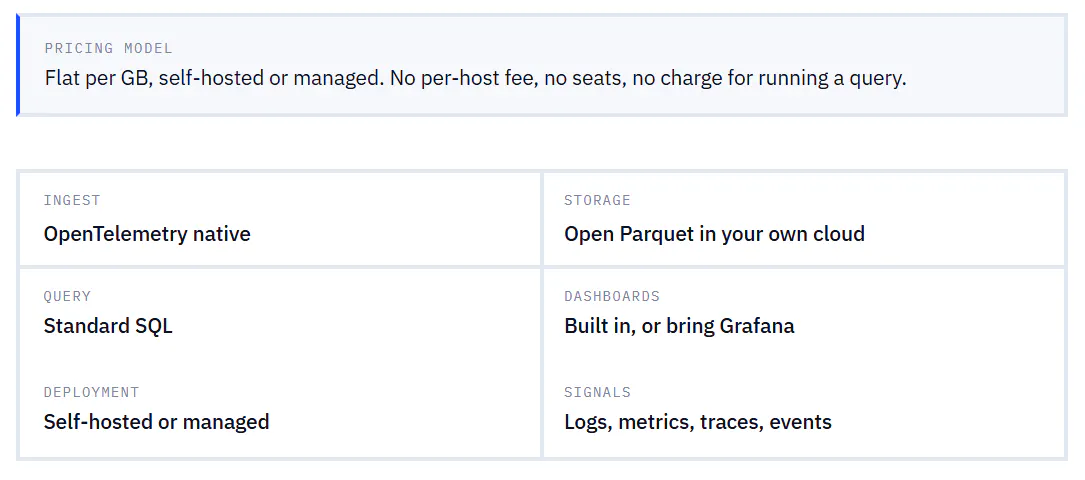
CtrlB is a data lake for telemetry, built for teams that have gone all in on OpenTelemetry. Most platforms keep your data in storage they own, which you pay for every month and cannot read without them. CtrlB works the other way round. Logs, metrics, traces and events are written into your own cloud storage in an open file format, and you search all of it with SQL, the language most engineers already know. Dashboards are built in and they are good, and if your team already lives in Grafana you can plug that in on top instead. Run it yourself or let CtrlB run it, flat per GB either way.
WHAT'S GOOD
- Keeping data for longer stops being a budget decision. Most platforms copy your data into a search index, and that index is what you rent. CtrlB keeps everything in ordinary cloud storage instead, which is far cheaper, so a full history costs up to 90% less than the same data on an index-based platform. No sampling, no tiers, no quarterly negotiation about how much of last month you can afford to keep.
- One place to look, one language to ask in. Searching raw log text and running the bigger number-crunching queries happen on the same data, in standard SQL. There is no second language for logs, no third one for traces, and no separate system you have to copy data into first.
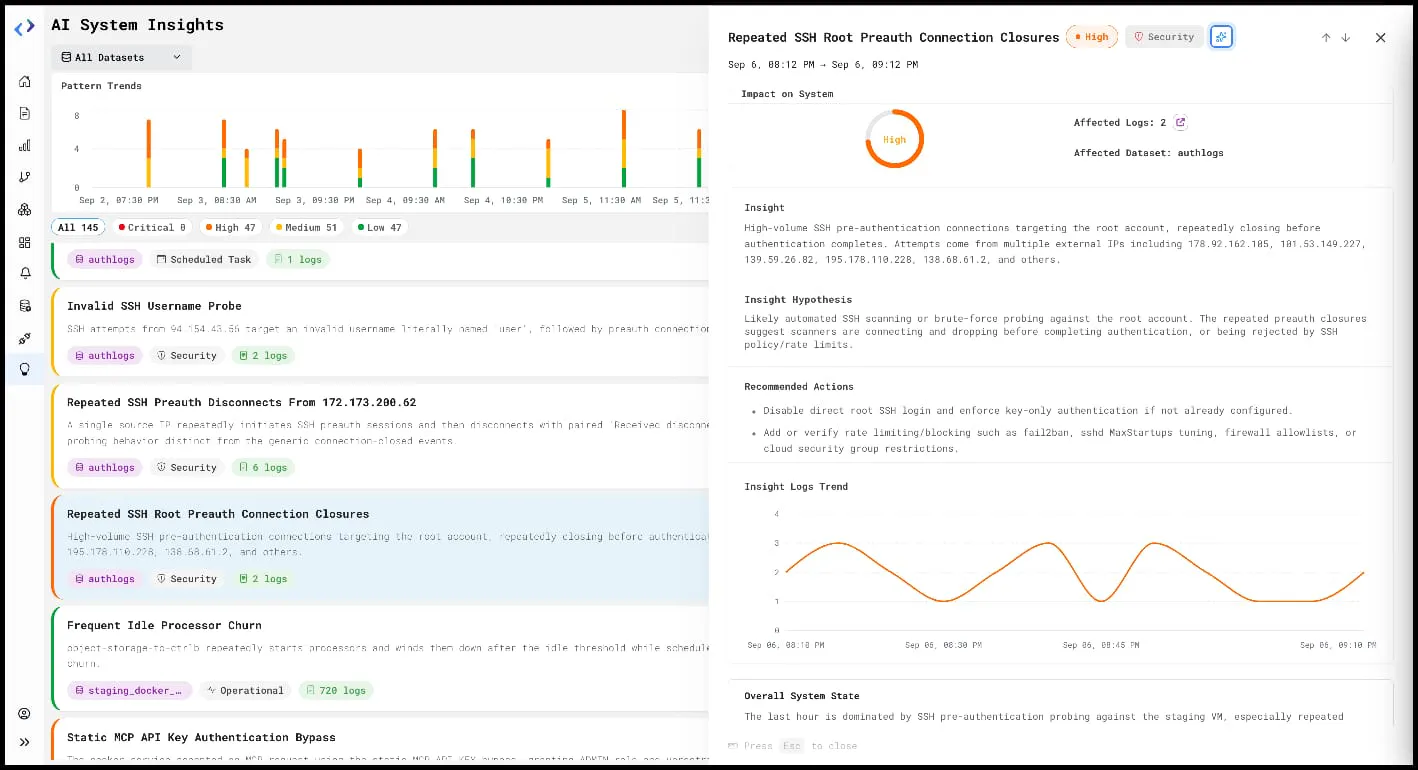
- The Insight Engine reads your data so you do not have to. It runs all the time, groups millions of near-identical log lines into a handful of patterns, and flags the odd ones: the rare event, the new error, the thing nobody wrote an alert for. Each finding comes with how serious it is, the data behind it, a plain explanation of what it thinks happened, and what to do next. You are not staring at an empty search box at two in the morning.
THE TRADE-OFF
- Younger than the big suites. The platform is moving quickly, but it does not yet have every single feature of a product that has been around for over a decade.

#2 Datadog
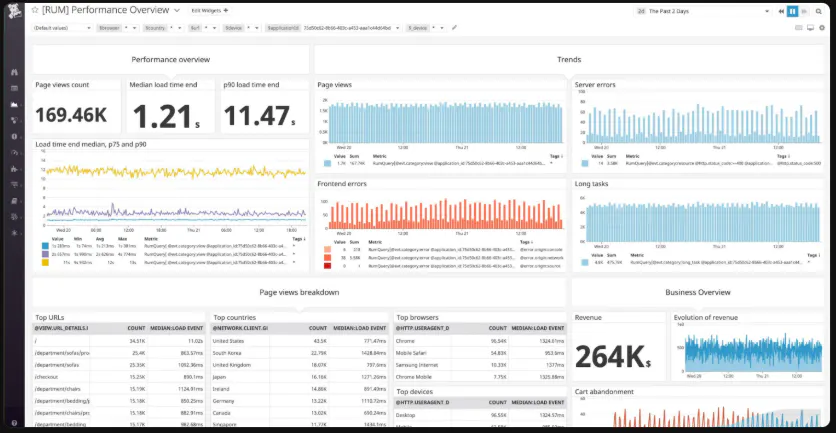
Datadog is a huge all-in-one service that does more or less everything: servers, application performance, logs, what real visitors experience in the browser, uptime checks, security, and more. If there is a kind of data you want to collect, Datadog probably sells a product for it.

WHAT'S GOOD
- The broadest product range on this list. Hundreds of ready-made integrations, every kind of data in one place, and alerting and incident handling that have had years to mature. For most teams there is no second tool to buy.
- Standard OpenTelemetry data goes straight in. You can send logs, metrics and traces in the open OTLP format without installing Datadog's own agent first. You can also search data held in other systems from inside Datadog, and keep log storage in your own cloud.
- The AI features do specific, checkable things. Bits looks into alerts and opens pull requests with suggested fixes, from inside error tracking, application monitoring and database monitoring. A separate console keeps an eye on outside coding agents such as Claude Code and Cursor alongside Datadog's own.
THE TRADE-OFF
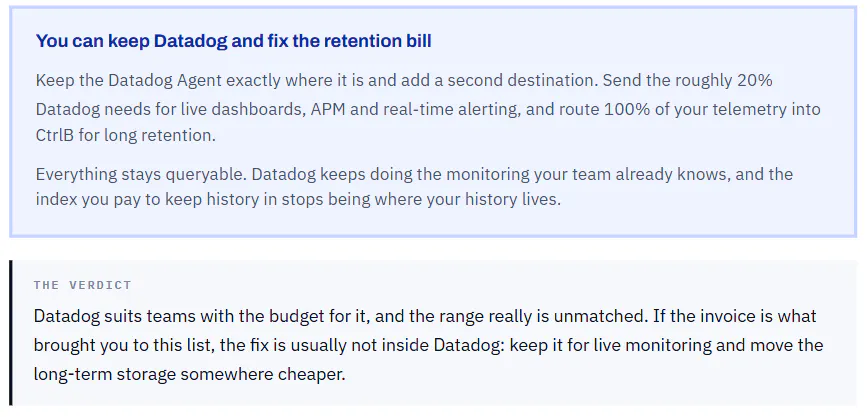
- Pricing is the main trade-off. Datadog charges separately for almost everything: per server, per gigabyte of logs, per trace kept, per custom metric, and again for each extra product. Working out what a month will cost before you commit is genuinely hard, and once your dashboards and alerts are built on Datadog's own formats, moving later means rebuilding them.
- Keeping logs for a long time gets expensive. Logs have to be indexed to stay searchable, and that index is the biggest line on most invoices. It is the reason teams end up keeping only a sample, or only a few days, which is exactly the history you want during a post-mortem.
#3 Grafana Stack
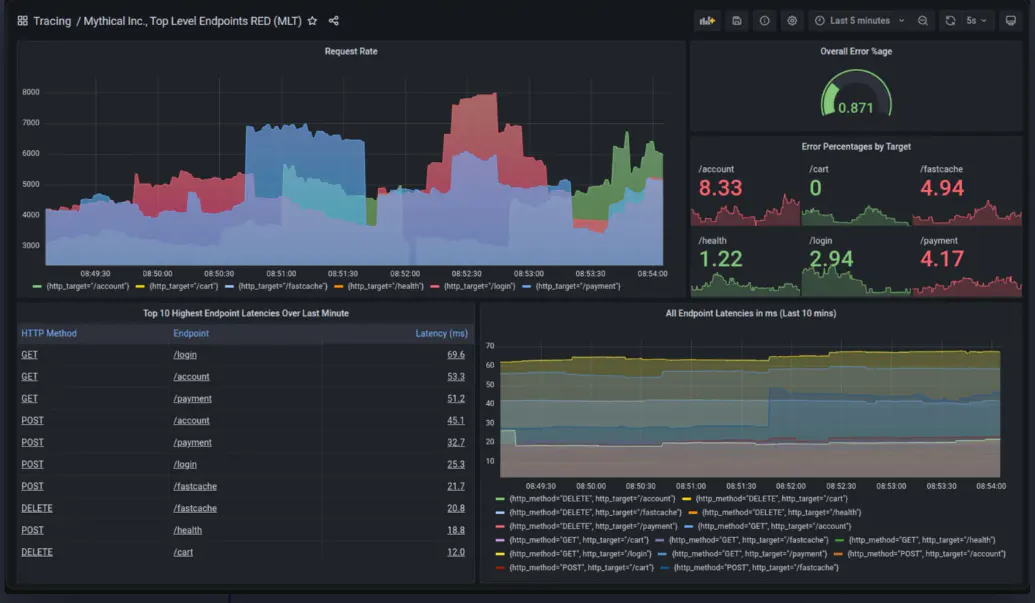
Grafana is the dashboard tool almost everyone already has. The wider Grafana Stack pairs it with three separate storage products underneath: Mimir for metrics, Loki for logs and Tempo for traces. You can run all of it yourself or buy it as Grafana Cloud.

WHAT'S GOOD
- Still one of the strongest dashboarding options. There is a connector for almost any data source you already run, and the dashboards are good enough that most teams keep Grafana even after replacing everything underneath it.
- Open source, and open standards throughout. An active community, no obligation to send your data anywhere, and Alloy for collecting OpenTelemetry data.
- The AI assistant is not Cloud-only. Grafana Assistant, which lets you ask for a query or a dashboard in plain English, is available in the open source and Enterprise versions too.
THE TRADE-OFF
- It is a set of products, not one product. Metrics, logs and traces live in three separate systems with three different query languages. Grafana's point-and-click Drilldown view hides that from you, but it does not join them up, and following a problem from one type of data to another is something you have to configure.
- How much work it is depends on which parts you run. Grafana on its own is light. Loki at real log volume is a system somebody looks after full time. Grafana Cloud takes that work away and gives you a bill instead, which at high log volumes lands closer to the commercial platforms than people expect.

#4 Dash0
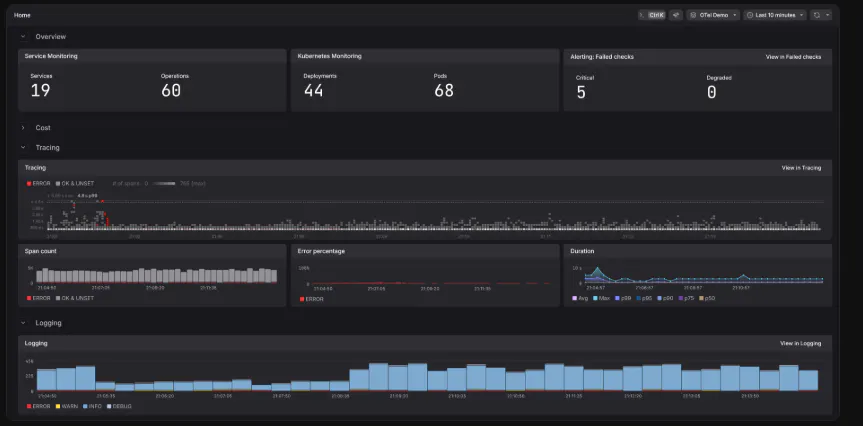
Dash0 is a hosted platform built around OpenTelemetry, aimed at teams running modern cloud systems. It takes standard OTLP data directly, uses PromQL as its one query language, and charges a flat rate for the data you send rather than per person.

WHAT'S GOOD
- Predictable, and portable. Oe flat rate for the data you send, with no charge per user and no charge for running a query. Queries, dashboards and collector settings are all in open formats, so you could take them elsewhere.
- One language, and no agent of their own to install. OpenTelemetry all the way through, with nothing converted into a private format on the way in, plus assistants that help with triage, dashboards and cost.
THE TRADE-OFF
- Hosted only. Your data goes to their cloud, which is enough to rule it out for teams with rules about where data may live.
- Less compelling outside OpenTelemetry-heavy teams. If you still rely on older agents, unusual integrations or systems that are not cloud native, the benefit is harder to see, and areas like uptime checking are thinner than at the older vendors.

#5 Elastic Observability
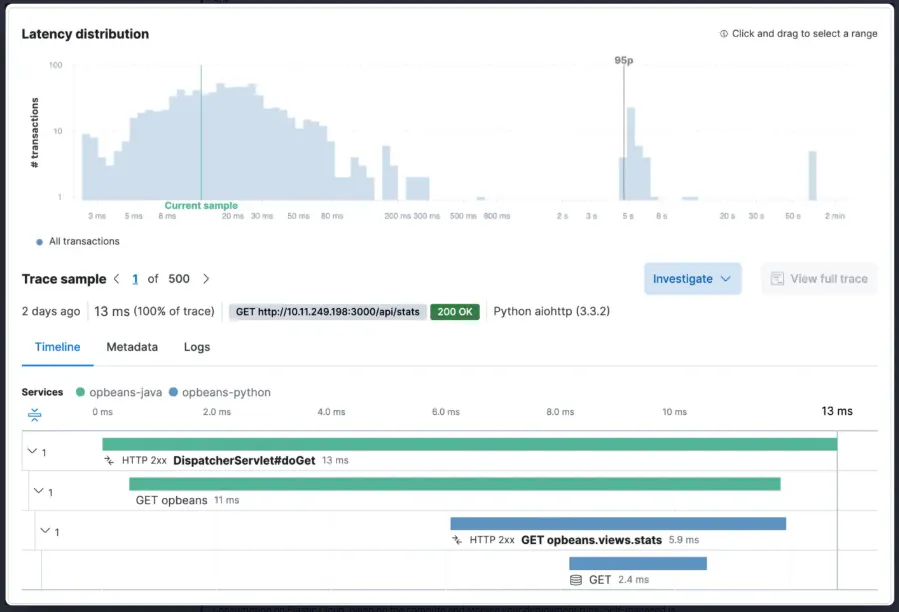
Elastic Observability is built on Elasticsearch, the search engine behind the ELK stack. It adds application performance monitoring and infrastructure monitoring on top of Elastic's log search, so searching is at the centre of how you use it.

WHAT'S GOOD
- Log search is the reason to pick it. Digging through messy, unpredictable log text is exactly what the engine underneath was built for, and it shows.
- OpenTelemetry is properly supported now. Elastic ships its own OpenTelemetry builds, its agent can act as an OpenTelemetry collector, and Prometheus metrics work as they are, with existing PromQL queries running unchanged.
- One language across the different data types. ES|QL, Elastic's query language, can pull logs, metrics and traces into a single query, so an investigation does not stop when you switch from one to another.
THE TRADE-OFF
- The cluster is the thing you really operate. Sizing, shards, storage tiers, data lifecycle rules. Running Elasticsearch well takes real expertise, and even a quiet cluster still needs its servers switched on.
- Cost grows with the index, not with what you search. Keeping more history means more machines and more copies of the data, so a long retention window gets expensive quickly.

#6 Dynatrace
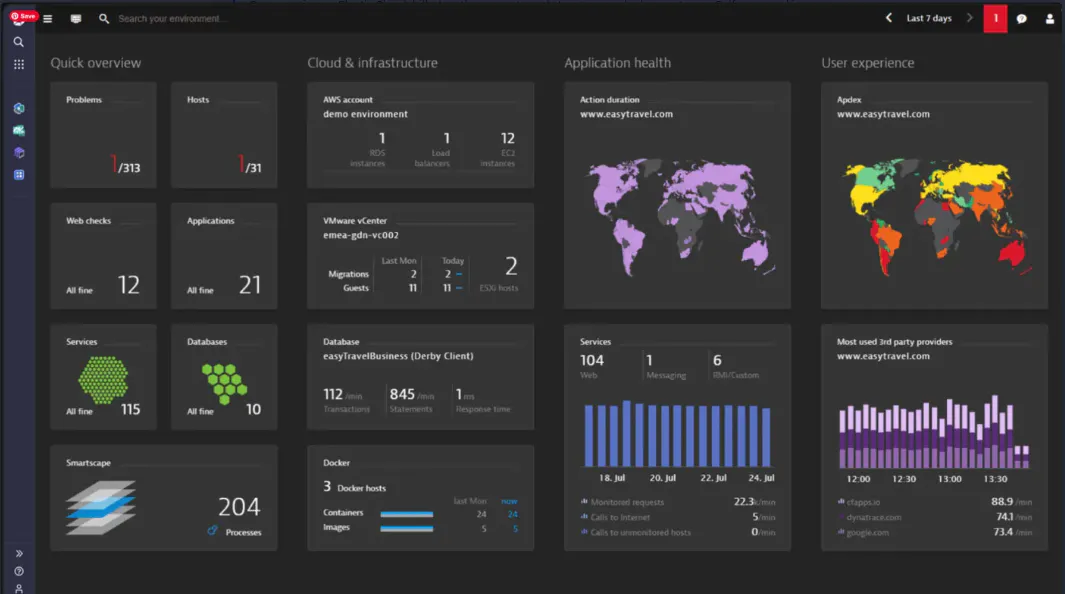
Dynatrace is an enterprise platform that leans heavily on automation. Rather than handing you a search box, it works out how your systems connect to each other and tells you what broke and why.

WHAT'S GOOD
- Strong automatic root-cause analysis. Dynatrace keeps a live map of how your services depend on one another and checks problems against it: which service slowed down, which release went out just before, which machine sits underneath. Its assistant answers from that map and the stored data rather than from your question alone.
- One agent covers the whole estate. OneAgent finds and instruments most of an environment by itself, which saves a lot of time at enterprise scale, and OpenTelemetry attributes now come through into its metrics properly.
THE TRADE-OFF
- You get the most out of it by committing to all of it. The agent, the storage layer and their query language are designed to work together, so adopting part of it returns a fraction of the benefit. It also means that when the automatic answer is wrong, you cannot easily check the reasoning yourself.
- Priced and scoped for large companies. The pricing has enough moving parts that most buyers need help forecasting it, and a rollout is a project for a platform team rather than an afternoon.

#7 SigNoz
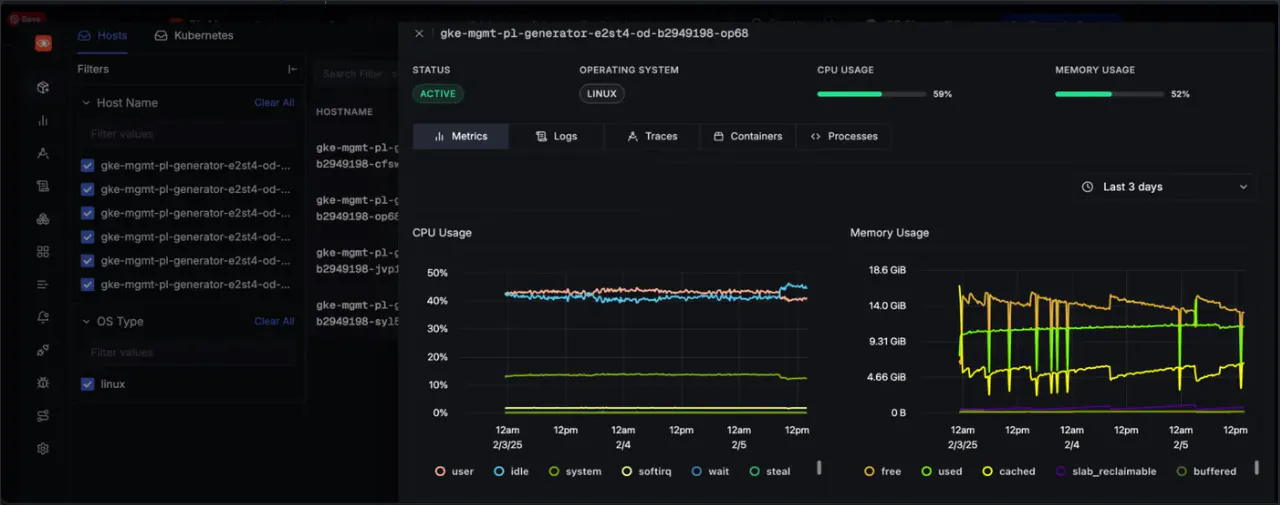
SigNoz is an open source platform built around OpenTelemetry from day one. Logs, metrics and traces sit together in one app on top of ClickHouse, a database designed for fast analysis of large datasets. Run it yourself or use their hosted version.

WHAT'S GOOD
- Open source, OpenTelemetry-native, and built on ClickHouse. That combination is the reason to look at it. OpenTelemetry's conventions are understood as they are rather than translated into something else, the whole thing can run inside your own environment, and the database underneath is one people already trust at scale.
- One app for all three data types. Logs, metrics and traces line up without you configuring the links, alongside full-text log search, infrastructure monitoring and dashboards in an open format.
THE TRADE-OFF
- Running it yourself means running ClickHouse. At your data volume and your retention, including upgrades and capacity planning. That is a real commitment once the volume grows.
- You will end up using more than one query language. A visual query builder covers most everyday work, PromQL handles metrics, and raw SQL is there for anything the builder cannot express. Worth checking during a trial: are the questions your team actually asks covered by the builder, or will people be writing SQL often enough that it becomes the real interface?

#8 New Relic
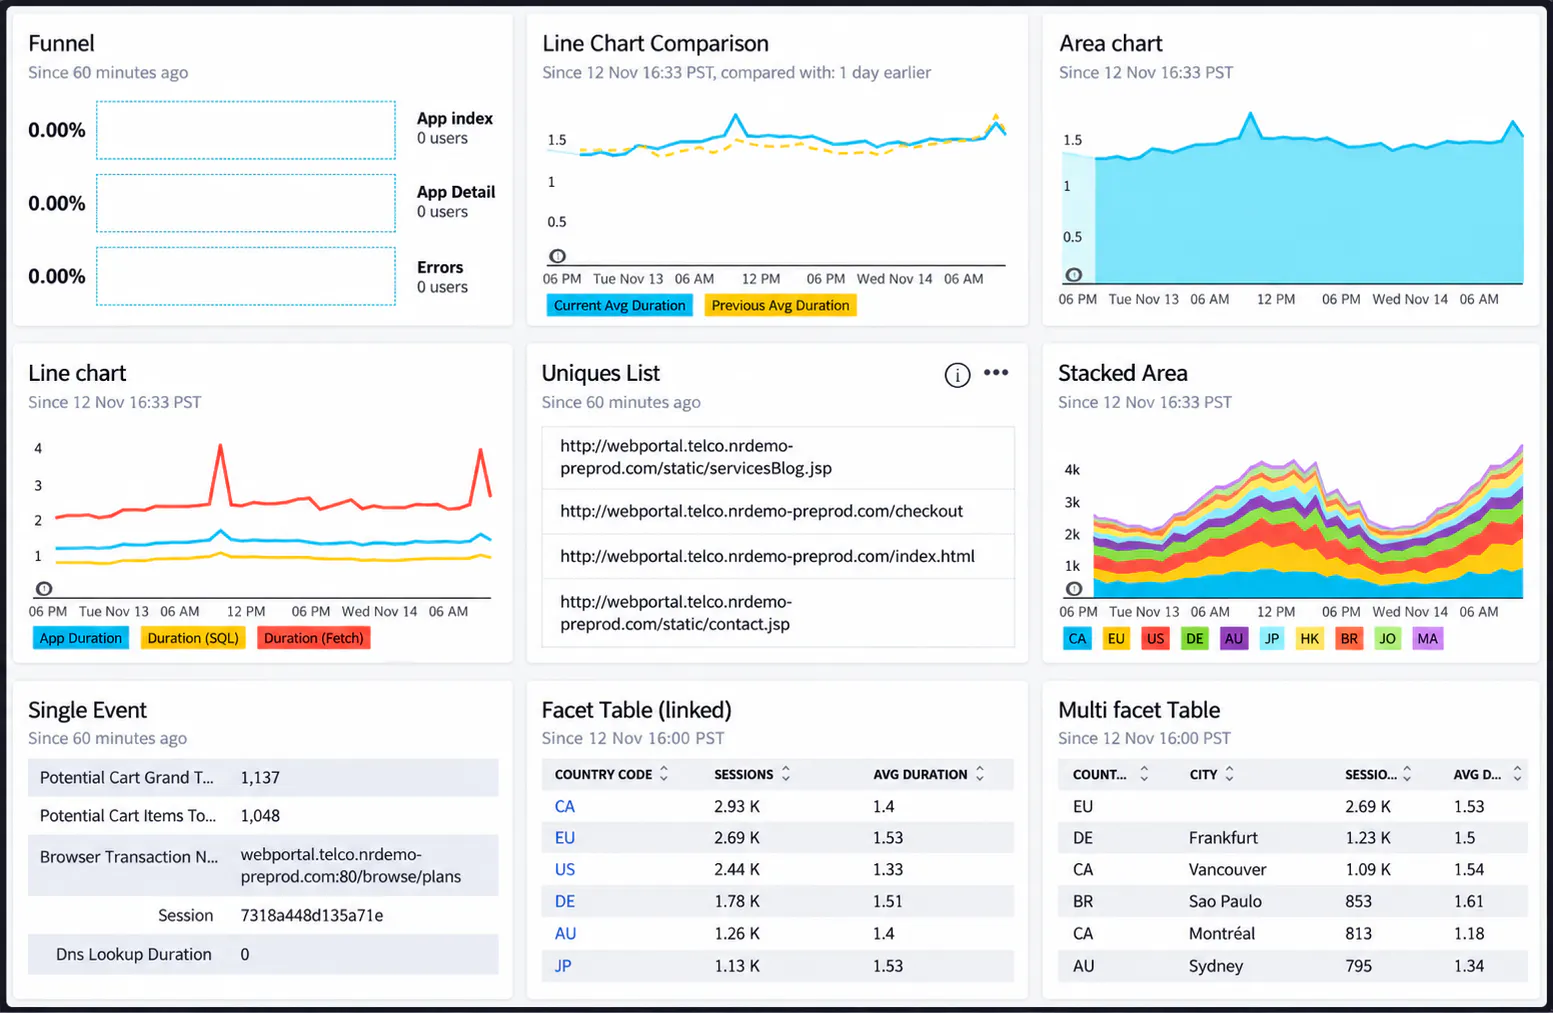
New Relic is one of the older application monitoring vendors that grew into a full observability platform. Everything lands in one database and is queried with one language, which makes it easier to follow a problem across different kinds of data than on a stack you assembled yourself.

WHAT'S GOOD
- One database, one language, strong application monitoring. Every kind of data goes to the same place and is queried the same way, which removes a whole class of problems. The free tier is unusually generous.
- Simplified pricing, sort of. It is far easier to follow than Datadog's, and the higher tiers can be bought purely on the data you send, with no per-person charge at all. It still repays reading closely, because the tier you pick decides whether per-person charges appear on your bill.
- Apps already sending OpenTelemetry data do not need their agent. If your services already emit OpenTelemetry traces, they go straight in.
THE TRADE-OFF
- Pricing depends on the plan you are looking at. Some tiers charge only for the data you send. Others also charge for each person with full access. Both are true at the same time, so check the specific plan rather than assuming either shape applies to you.
- Volume drives the cost, and their query language does not travel. Chatty logging is what makes the bill grow, and dashboards written in NRQL, New Relic's own language, stay where they are.

#9 groundcover
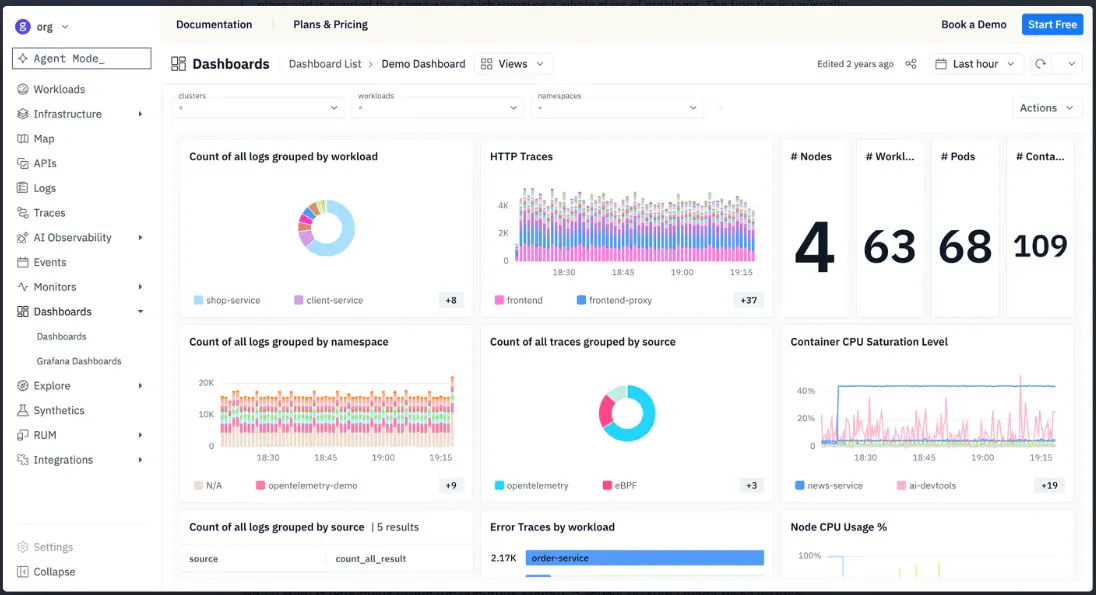
groundcover is a monitoring platform for Kubernetes built on eBPF, a Linux feature that lets software watch what is happening inside the operating system. A sensor on your cluster picks up logs, metrics, traces, application performance and browser data without anyone changing application code, and the whole thing runs inside your own cloud rather than at a vendor.

WHAT'S GOOD
- Your data never leaves your own cloud. The platform is split in two: groundcover runs the control side, and the part that stores and processes your data sits in your own cloud account. For teams with rules about where data may live, that ends the conversation before it starts.
- Very little to add to your applications. The eBPF sensor watches traffic inside the operating system rather than from inside your code, so one install on the cluster covers infrastructure, Kubernetes, application traffic and AI workloads without adding libraries to every service or redeploying anything.
- Priced per machine, so volume is not the cost driver. The bill follows the size of your cluster rather than how much data you send, which removes the temptation to throw data away to protect the budget.
THE TRADE-OFF
- Collection is their sensor, not OpenTelemetry. Picking data up with no code changes is the whole point of the design, but it does mean the collection layer belongs to them. If you have already standardised on OpenTelemetry collectors, this runs as a second pipeline beside them.
- Kubernetes first. The design assumes clusters, so estates with a lot running outside Kubernetes get less from it, and the storage side running in your own cloud is still infrastructure your team looks after.

#10 Honeycomb
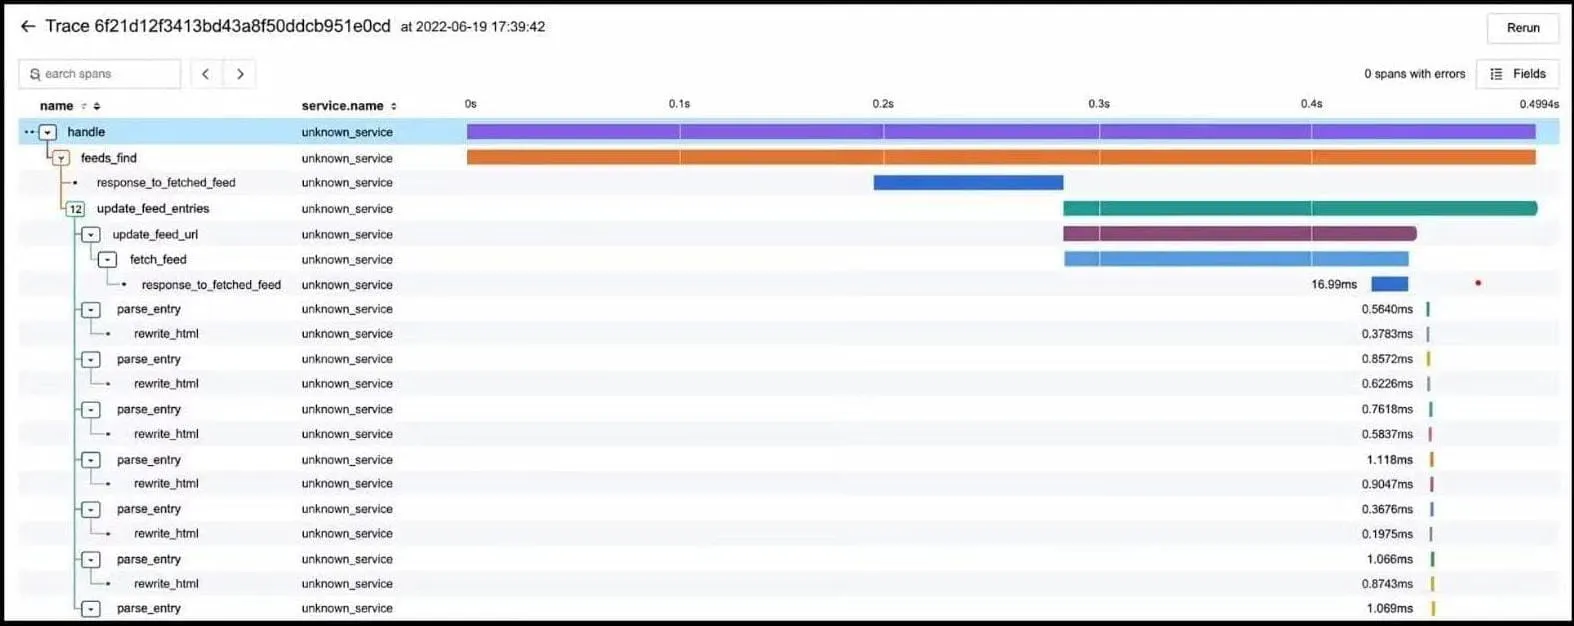
Honeycomb was built for investigating complicated systems. It stores rich events rather than plain log lines, and it copes well with fields that have huge numbers of possible values, such as a customer ID. It exists for the questions nobody planned for, which is where you usually are when something breaks in a way no dashboard predicted.

WHAT'S GOOD
- The strongest tool here for open-ended investigation. Break the data down by any field you like, including customer or request details, and its outlier analysis tells you what the slow or failing requests have in common. That takes a lot of guesswork out of an investigation.
- Metrics alongside events. Regular time-series metrics now sit on the same platform as the event data, with solid OpenTelemetry support and connections that let AI coding tools investigate directly.
THE TRADE-OFF
- Charged per event, and the rate went up. Metrics and the AI tooling were folded into the plan in 2026. It is a better package, and it costs more.
- Excellent for investigation, not necessarily the only platform you will need. Server dashboards, network device monitoring and broad infrastructure coverage are not the strength, and the way it models data takes a team a while to get used to. Most Honeycomb users run something else alongside it.

Final Thoughts
Supporting OpenTelemetry is no longer something that sets a platform apart. They have all caught up on collecting data, and the real differences now show up in where the data is stored, how long you can afford to keep it, how easy it is to ask questions of it, whether it runs in your cloud or theirs, and what it costs.
That is also where the money goes, and where the blind spots come from. Platforms that keep your data in their own storage charge you for the privilege every month, which is why teams cut back to a sample or a few days, and then find the week they needed is gone.
For teams already running OpenTelemetry, the practical question is a simple one: where do you want your data to live for the long term? If the cost of keeping it is what is holding you back, CtrlB is worth evaluating. Point one collector at it, keep everything for a month, and compare the search times and the invoice with what you run today.