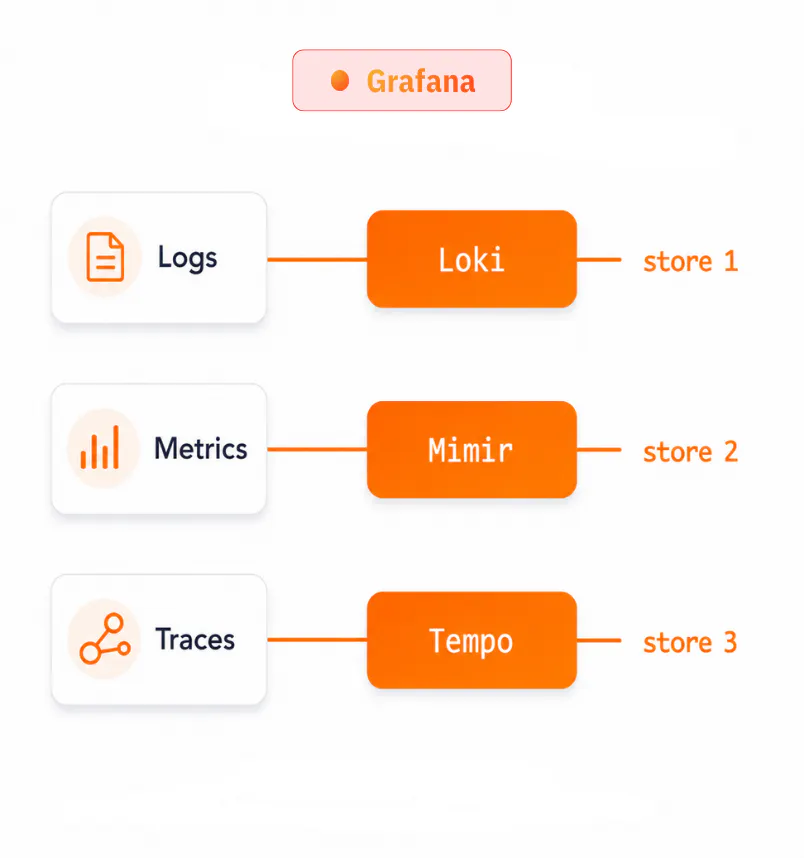
The Grafana LGTM stack (Loki, Mimir, Tempo) spreads every signal across separate backends you must wire together and tune.
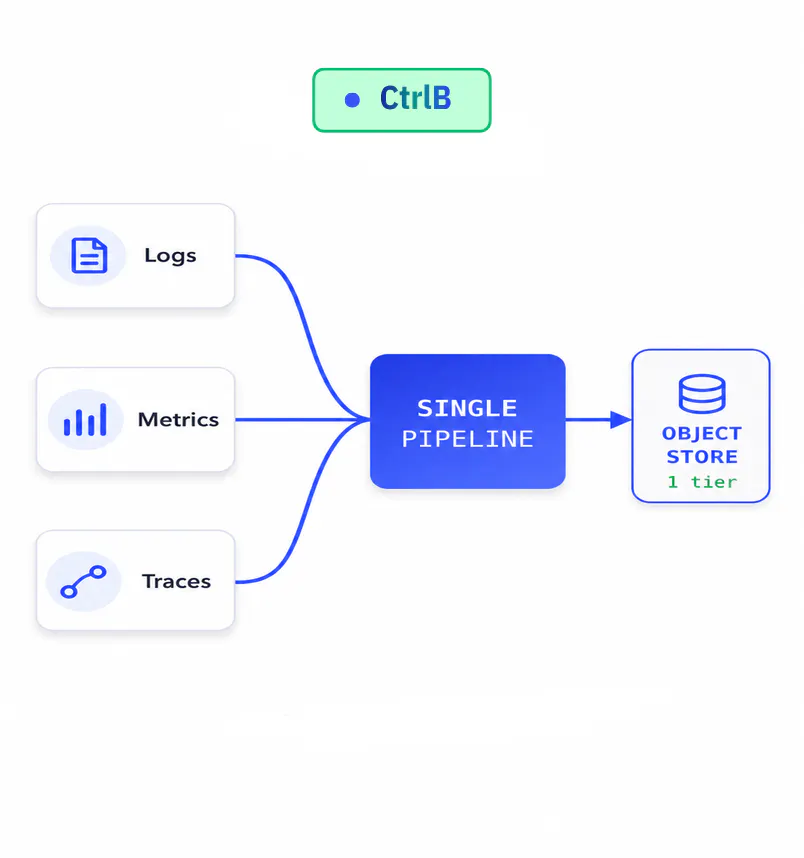
CtrlB takes the opposite bet: one pipeline, one query language, one open storage format.
Here's a point-by-point comparison of why the unified approach wins.
Both platforms get you logs, metrics, and traces in one pane of glass. The difference is what happens underneath the dashboard. Grafana LGTM is a modular system of specialized backends you compose and tune. CtrlB is a single architecture where every signal flows through one pipeline into one open storage tier, queried with one language. The eight comparisons below walk through exactly where CtrlB pulls ahead.
Dimension | CtrlB | Grafana LGTM |
|---|---|---|
Backend architecture | Unified data lake | Fragmented |
Query language | Single SQL layer | Three to learn |
Search speed | Sub-600 ms | Bolt-on |
Pricing model | Flat $0.20/GB | Dimensional |
Protocols & APIs | PostgreSQL wire | Per-API clients |
Ingestion | Single pipeline | Routed |
Operations | Zero-touch | Many parts |
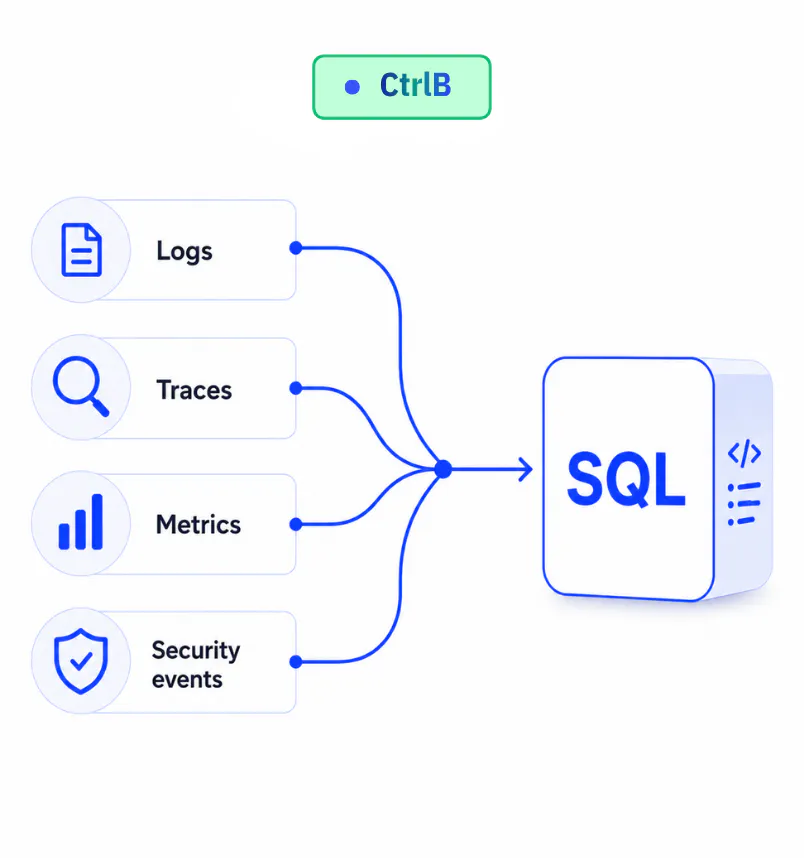
CtrlB
Unified data lake
CtrlB is a disk-less, unified data lake: logs, metrics, traces and security events all live in one scalable foundation as a single source of truth. One system, one copy of the data, no silos and no parallel pipelines to keep in sync.
● one pipeline, zero silos
Grafana
Composable backends
Relies on a modular multi-system backend. While the UI is unified, the backend consists of specialized data stores (Loki, Mimir, Tempo) that you can deploy individually or together based on your needs.
▲ three stores to run & sync
CtrlB
One language
CtrlB exposes one SQL interface powered by Apache DataFusion across every signal. Full-text lookups, real-time aggregations and time-range analysis all run as plain SQL on a single engine, so there's no separate query language to learn per signal.
● learn once, query everything
Grafana
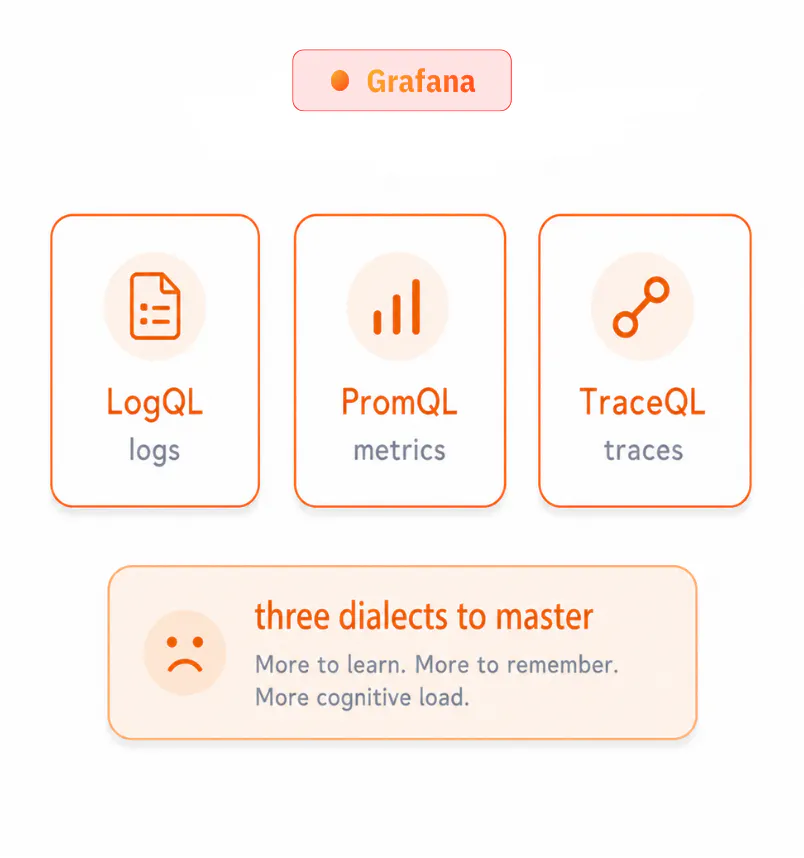
LGTM Three languages
Provides highly optimized query languages built for specific signals (LogQL, PromQL, TraceQL). While distinct, the Grafana UI natively correlates these signals so you can visually and contextually pivot between logs, metrics, and traces without manual query rewrites.
▲ three query languages to learn
CtrlB
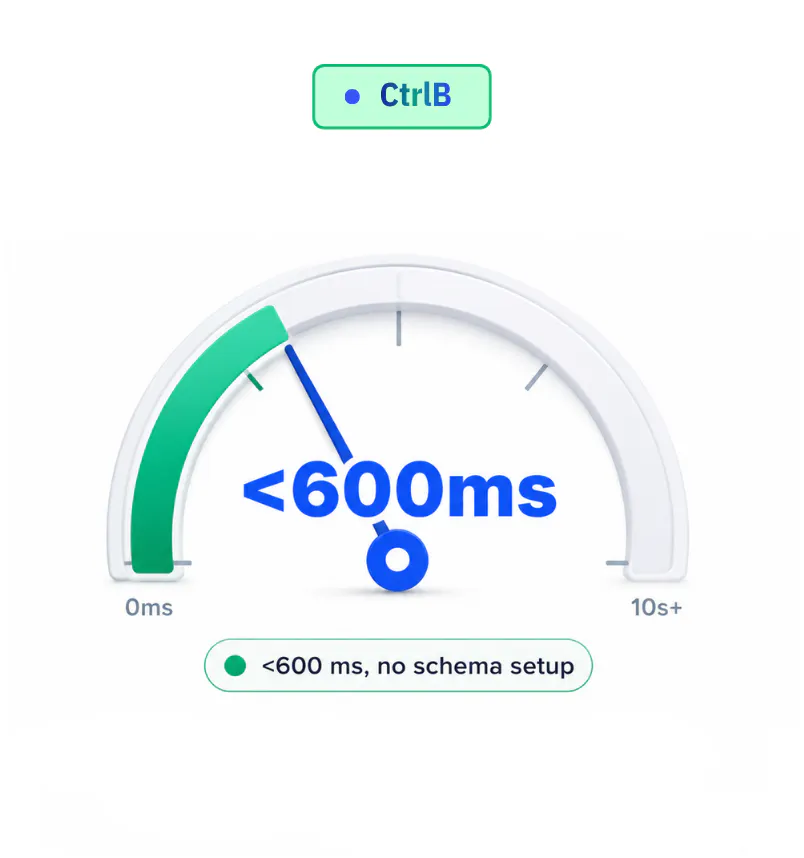
Schemaless, fast by default
CtrlB indexes every record exactly once on the way in compaction is a math operation, never a re-processing pass. You can throw completely unstructured telemetry at it with no schema setup and still get point lookups in roughly 600 milliseconds, because its probabilistic index stays small and fast even at petabyte scale. Logs are searchable the moment they land.
● <600 ms, no schema setup
Grafana
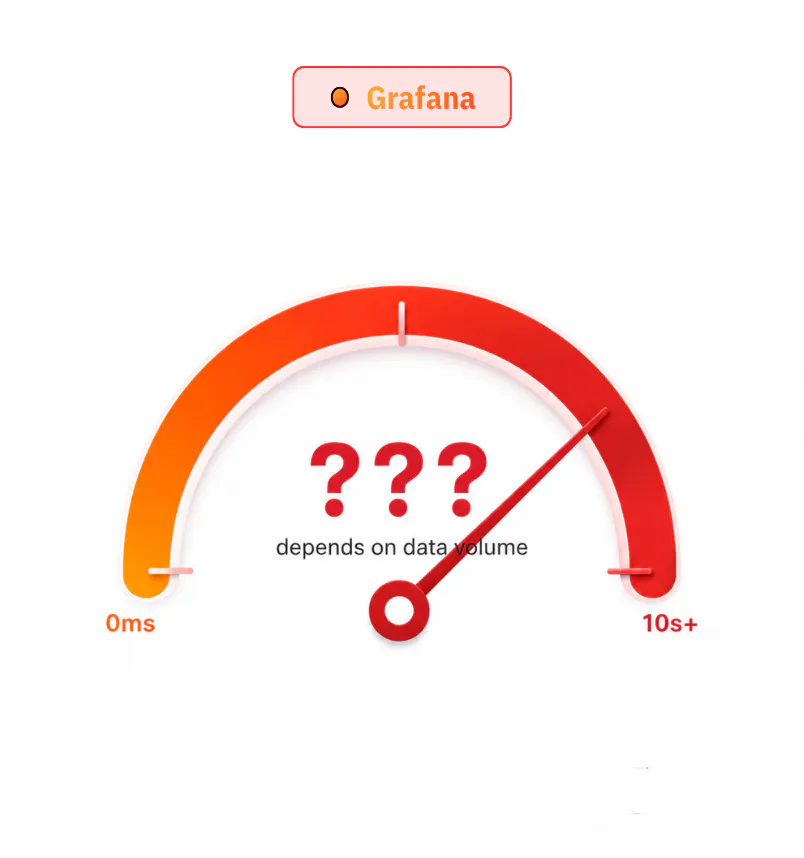
LGTM Label-indexed
Loki utilizes a lightweight, label-only index that does not natively accelerate full-text content queries. To avoid high-cardinality stream explosion, engineers must carefully manage labels, and achieving fast content search across unstructured logs requires opting into complex extra infrastructure like Bloom filters.
▲ fast search is bolt-on only
CtrlB
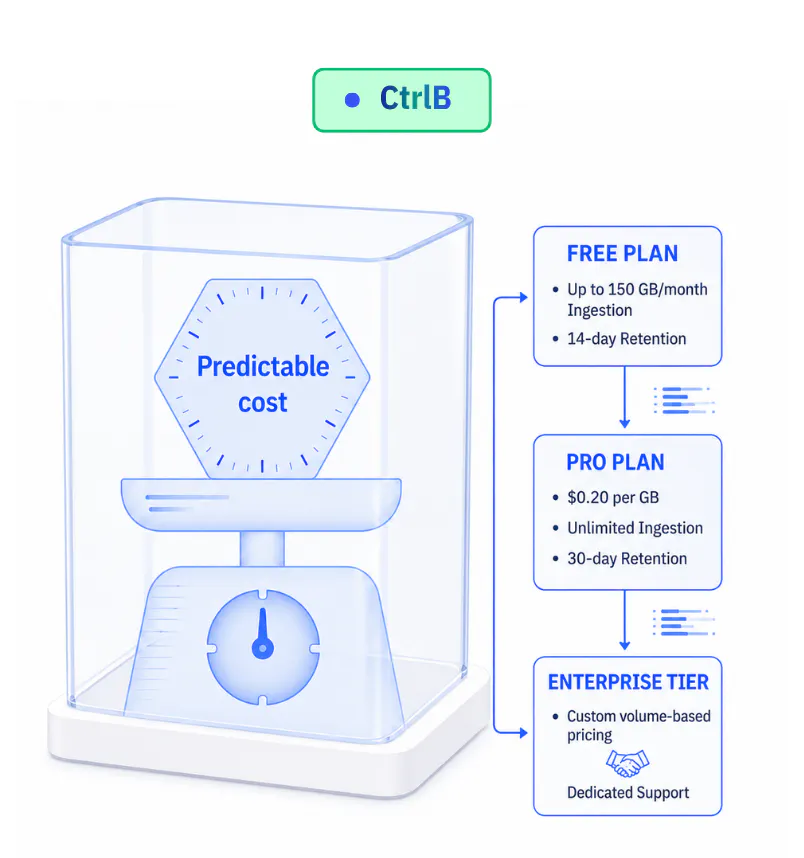
Flat $0.20 / GB
Because CtrlB keeps everything on your own object storage at object-storage prices and spins up compute only when queries run, pricing is a simple flat $0.20 per GB of volume up to 90% less than legacy observability stacks. Zero hidden charges for seat counts, alerts, dashboards, or ad-hoc query volumes.
● one number to forecast
Grafana
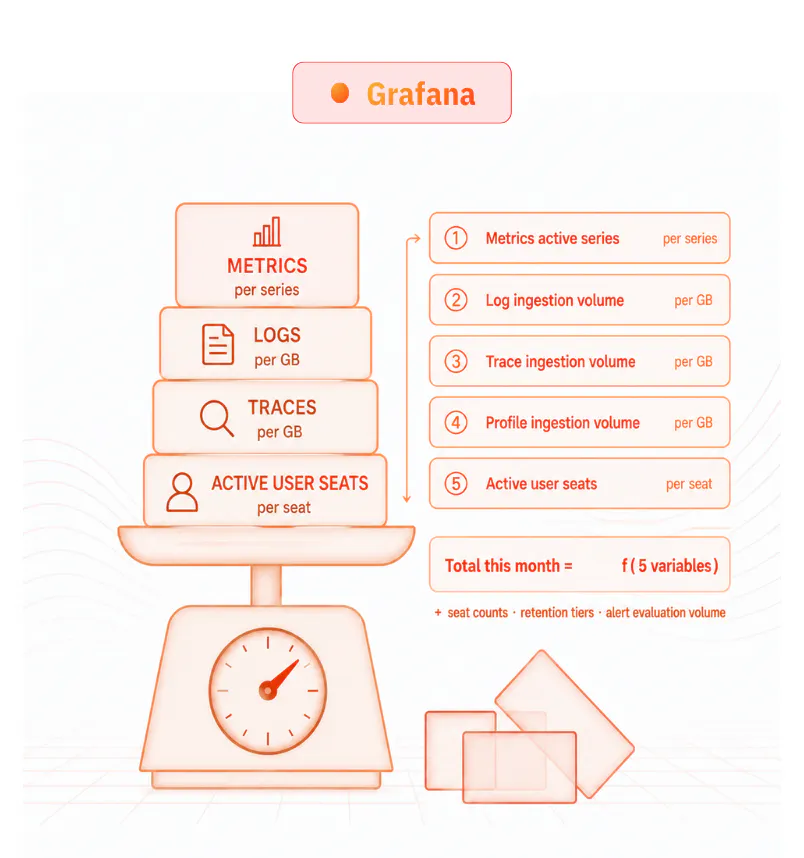
LGTM Dimensional billing
Grafana Cloud pricing is dimensional, billing based on active series for metrics, GBs for logs/traces, and active user seats requiring careful capacity planning as you scale. Self-managed Assistant became free in April 2026, but Cloud customers pay both. As telemetry grows, organizations must monitor pricing to avoid cost increases.
▲ many dimensions to forecast
CtrlB
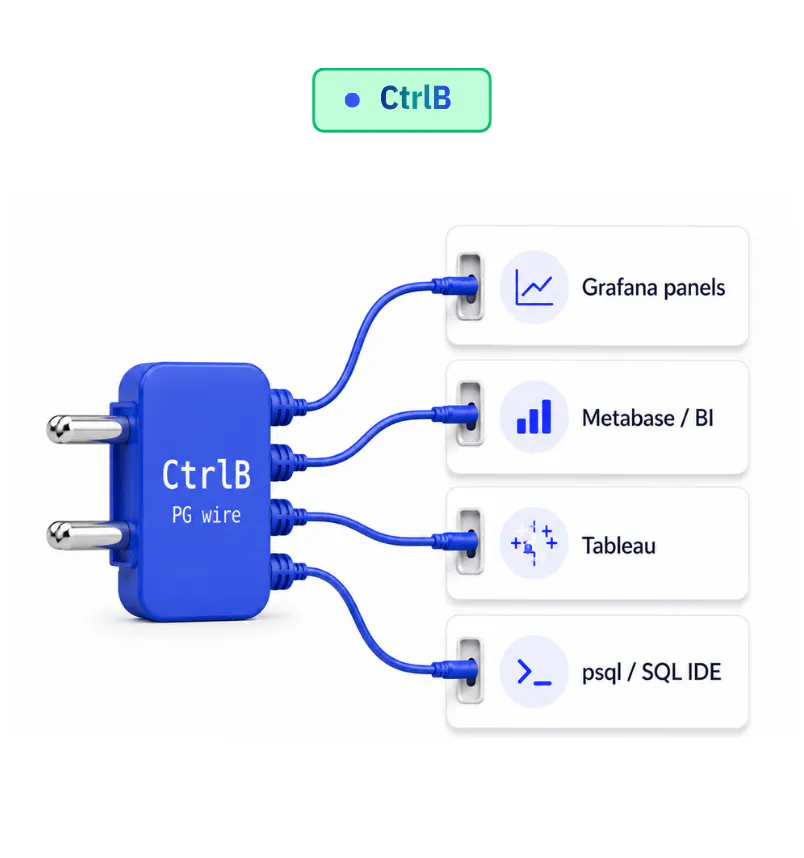
PostgreSQL wire
CtrlB speaks the PostgreSQL wire protocol natively, so it drops straight into the tools you already use. Grafana, Metabase, psql, and standard BI dashboards connect to it like any SQL database, with no custom clients, adapters, or proprietary integrations to build or maintain.
● plug into BI & SQL tools today
Grafana
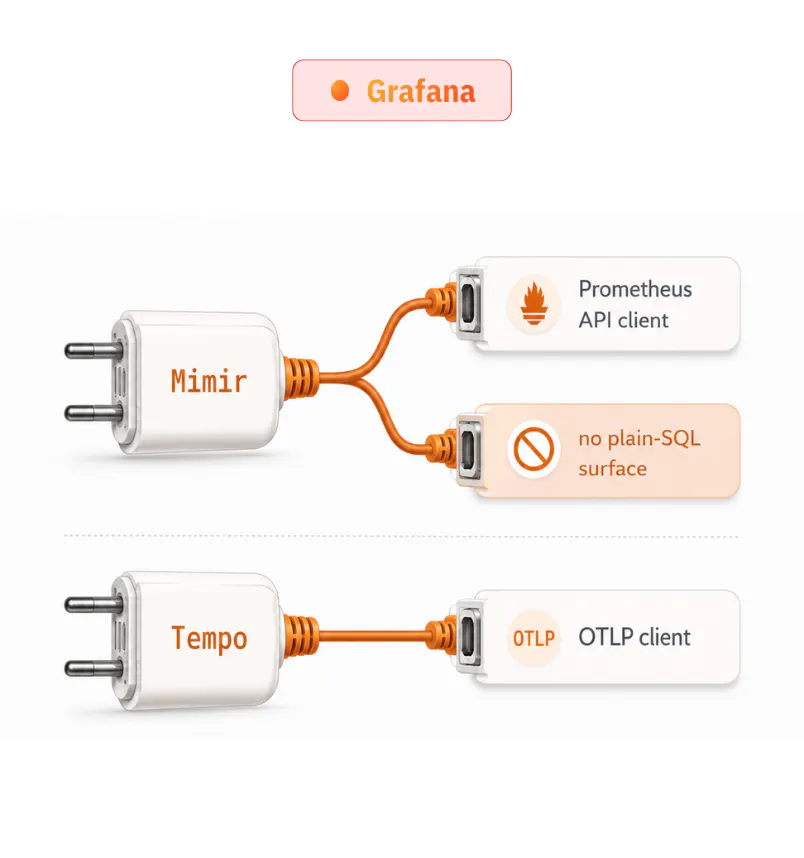
LGTM Open standard APIs
Exposes standard, community-adopted APIs (Prometheus API for Mimir, OTLP for Tempo), ensuring compatibility with cloud-native monitoring ecosystems. These APIs integrate seamlessly with observability tools and existing telemetry pipelines across modern infrastructure environments.
▲ no native SQL extra glue for BI tools
CtrlB
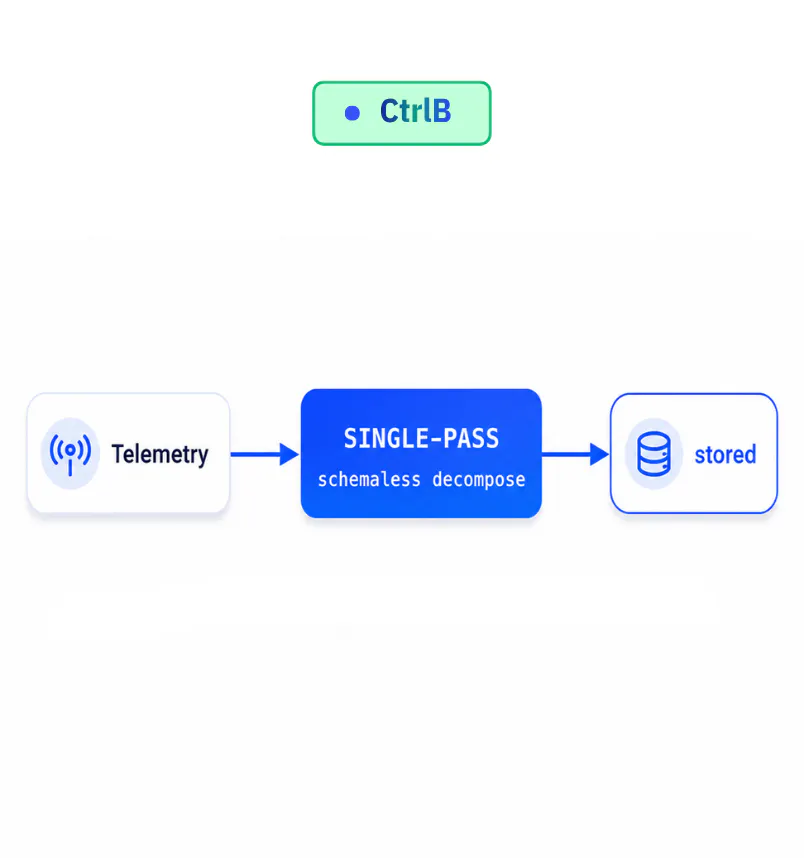
Schemaless single-pass
CtrlB accepts raw JSON with no predefined schema columns are discovered from the data itself. A single lock-free pass splits each log line into its repeating template and its changing values, encoding each value by type on the fly. This exploits the statistical shape of real log data to compress aggressively while keeping every field searchable, no rigid schemas to define up front.
● no rigid schemas to define
Grafana
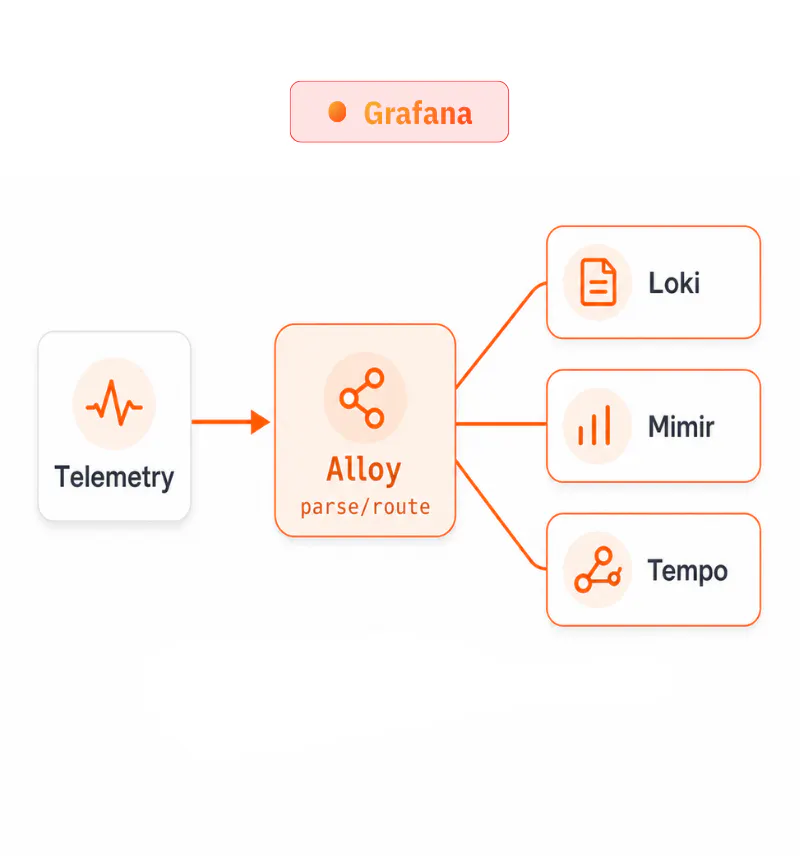
LGTM Routed & structured
Requires strict routing and formatting. Collectors like Grafana Alloy must use deterministic JSON or Logfmt parsers to clean, structure, and split telemetry into formats that match the schemas required by Loki, Mimir, and Tempo. This pipeline demands explicit configuration, schema-aware transformations, and routing logic before telemetry can be stored and queried efficiently.
▲ parse & route for every backend
CtrlB
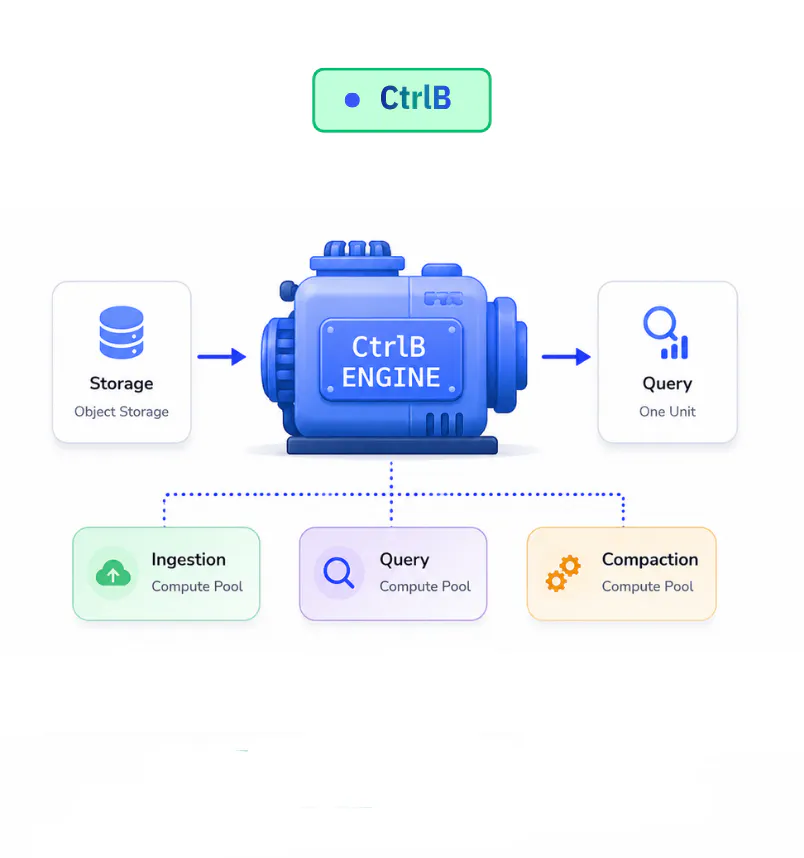
Zero-touch
CtrlB separates ingestion, queries, and compaction into independent compute pools, fully decoupled from storage. Compute scales on demand, so ingestion bursts never impact queries, while petabyte-scale data stays in object storage with minimal operational overhead.
● scales without babysitting
Grafana
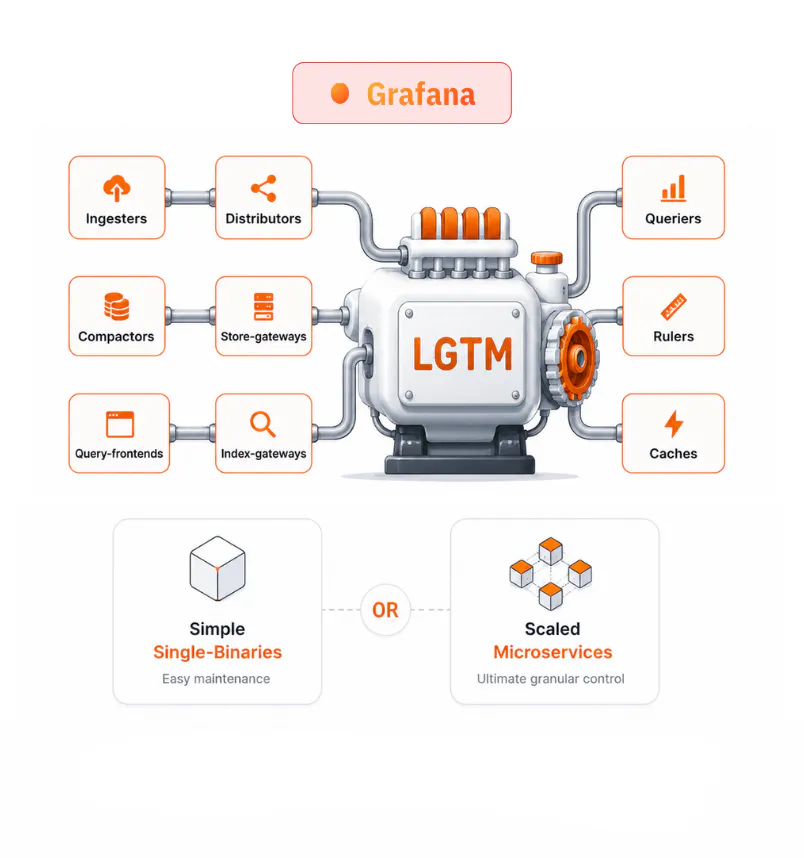
LGTM Flexible modes
Can be deployed as simple single-binaries for easy maintenance, or scaled out into dedicated microservices (ingesters, compactors, store-gateways), offering ultimate granular control, operational flexibility and performance optimization for massive enterprise-scale deployments.
▲ more moving parts to tune
One engine that just works
Grafana LGTM and CtrlB solve the same problem with opposite instincts but fragmentation comes at a cost. Where LGTM spreads your telemetry across separate backends, query languages, storage formats and microservices to wire together and tune, CtrlB collapses the stack into one schemaless pipeline, one SQL layer, and one open Parquet store. The result: sub-second search, predictable pricing, no lock-in, and far less to operate.
Reach for CtrlB when
- You want sub-second search across all signals without managing labels or extra search infrastructure
- You'd rather query everything in plain SQL and plug straight into existing BI tools
- Flat, predictable $0.20/GB billing beats forecasting series, GBs and seats
- You want your data in open Parquet with zero vendor lock-in and minimal ops overhead
You don't have to scrap your dashboards to fix the stack
Transitioning away from a fragmented observability stack does not require scrapping your existing dashboards. Because CtrlB speaks the PostgreSQL wire protocol natively, it connects directly to your existing Grafana panels, BI tools and monitoring workflows. The storage layer changes; the front-end experience stays familiar.
The pattern is consistent across every layer of the architecture: a single storage format, a single query interface, a search engine designed around the statistical shape of real log data and an ingestion pipeline that compresses aggressively without adding processing complexity. Fragmentation is not an inevitable feature of observability at scale. It is an architectural choice and architectural choices can be revisited.
One pipeline. One language. Sub-second search.
Point CtrlB at your telemetry and watch unstructured logs become instantly searchable, no schemas, no label gymnastics, no surprise bill.