Turning Telemetry into Reliability Targets the Business Can Trust
A field guide for OpenTelemetry-native organizations that want service level objectives their engineers and their leadership can both stand behind.
In the years I have spent building and overseeing reliability programs at scale, one lesson has held up better than any other. The hardest part of a service level objective initiative is almost never the instrumentation. Organizations that have committed to OpenTelemetry already produce a continuous stream of structured well-labeled signal. What distinguishes the teams that build a durable reliability culture from the ones that stall is whether they can state, precisely and in a form every stakeholder accepts, what good actually means for each service. OpenSLO is the layer that turns that agreement into something executable.
This is the approach I recommend to engineering and security leaders whose platforms already speak OpenTelemetry. It connects the telemetry you are already paying to collect to the reliability targets your board and your on-call engineers will both depend on. It does so without a single new line of instrumentation. The investment you made in observability becomes the foundation of an accountable reliability practice rather than another dashboard nobody reads.
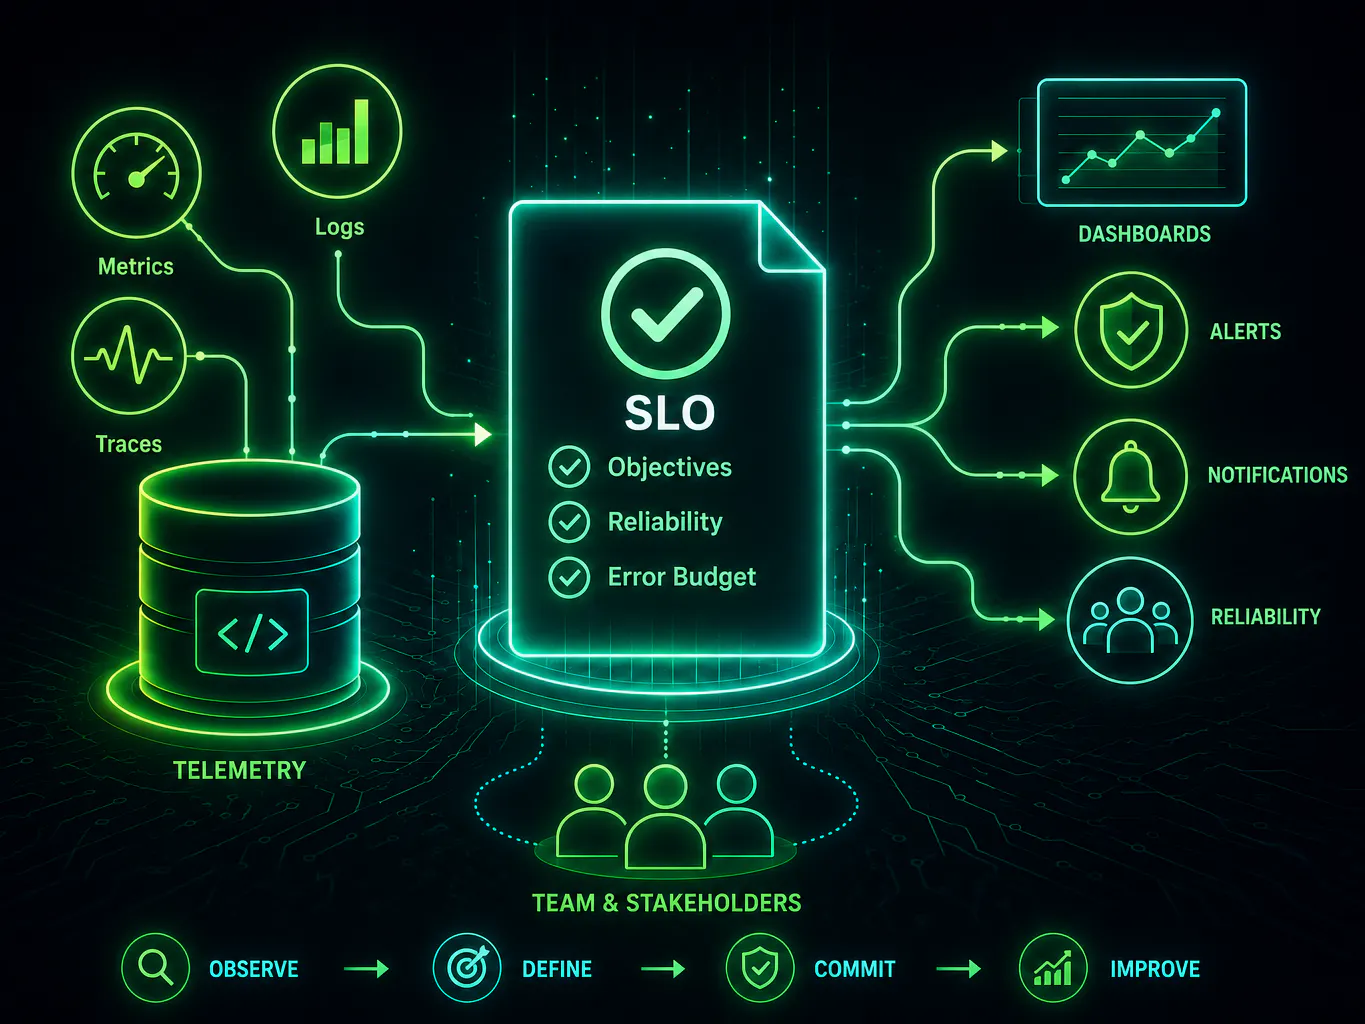
Three terms, one shared contract
Before the architecture, the vocabulary. These three terms carry the entire conversation. The discipline of defining them well is what separates a real reliability program from a wall of graphs.
Service Level Indicator (SLI). A measurement of service health expressed from the perspective of the customer. It is the building block that defines individual measurements and indicates whether a given measurement is successful or not.
Service Level Objective (SLO). The target you commit to for that indicator over a defined window of time. It defines how many failures are acceptable over the total number of measurements taken by SLIs eg. 99.9 percent of requests succeeding over a rolling 30 days. The SLO is the promise. It is the number you are prepared to defend in a quarterly review.
Error budget. The precise quantity of failure the objective permits. A target of 99.9 percent grants a budget of 0.1 percent. When the budget is healthy the organization can move quickly and take risk. When it is depleted the same number gives you the authority to slow risky change without a debate. This is governance expressed as math.
OpenTelemetry supplies the raw signal. OpenSLO supplies the contract. Treating them as two halves of one system is the mental model that makes everything that follows straightforward.
Why OpenTelemetry-native organizations start ahead
OpenTelemetry data adheres to shared semantic conventions, which means your metrics already carry predictable names and attributes across every service. An HTTP server records its latency as http.server.request.duration. Because that naming is consistent your indicators become close to portable.
You also inherit a vendor neutral pipeline. The OpenTelemetry Collector receives, processes and exports your data to one or more destinations, so a single set of metrics can drive dashboards, alerts and SLOs at once. By duplicate-broadcasting a single stream of telemetry at the collector level, the exact same raw data can be routed to Prometheus for immediate alerts, an OpenSLO engine for tracking error budgets and a visualization tool like Grafana for engineering dashboards. This internal "fan-out" design ensures absolute consistency across all your reliability targets without imposing any performance overhead or forcing you to rewrite a single line of application code.
What OpenSLO contributes
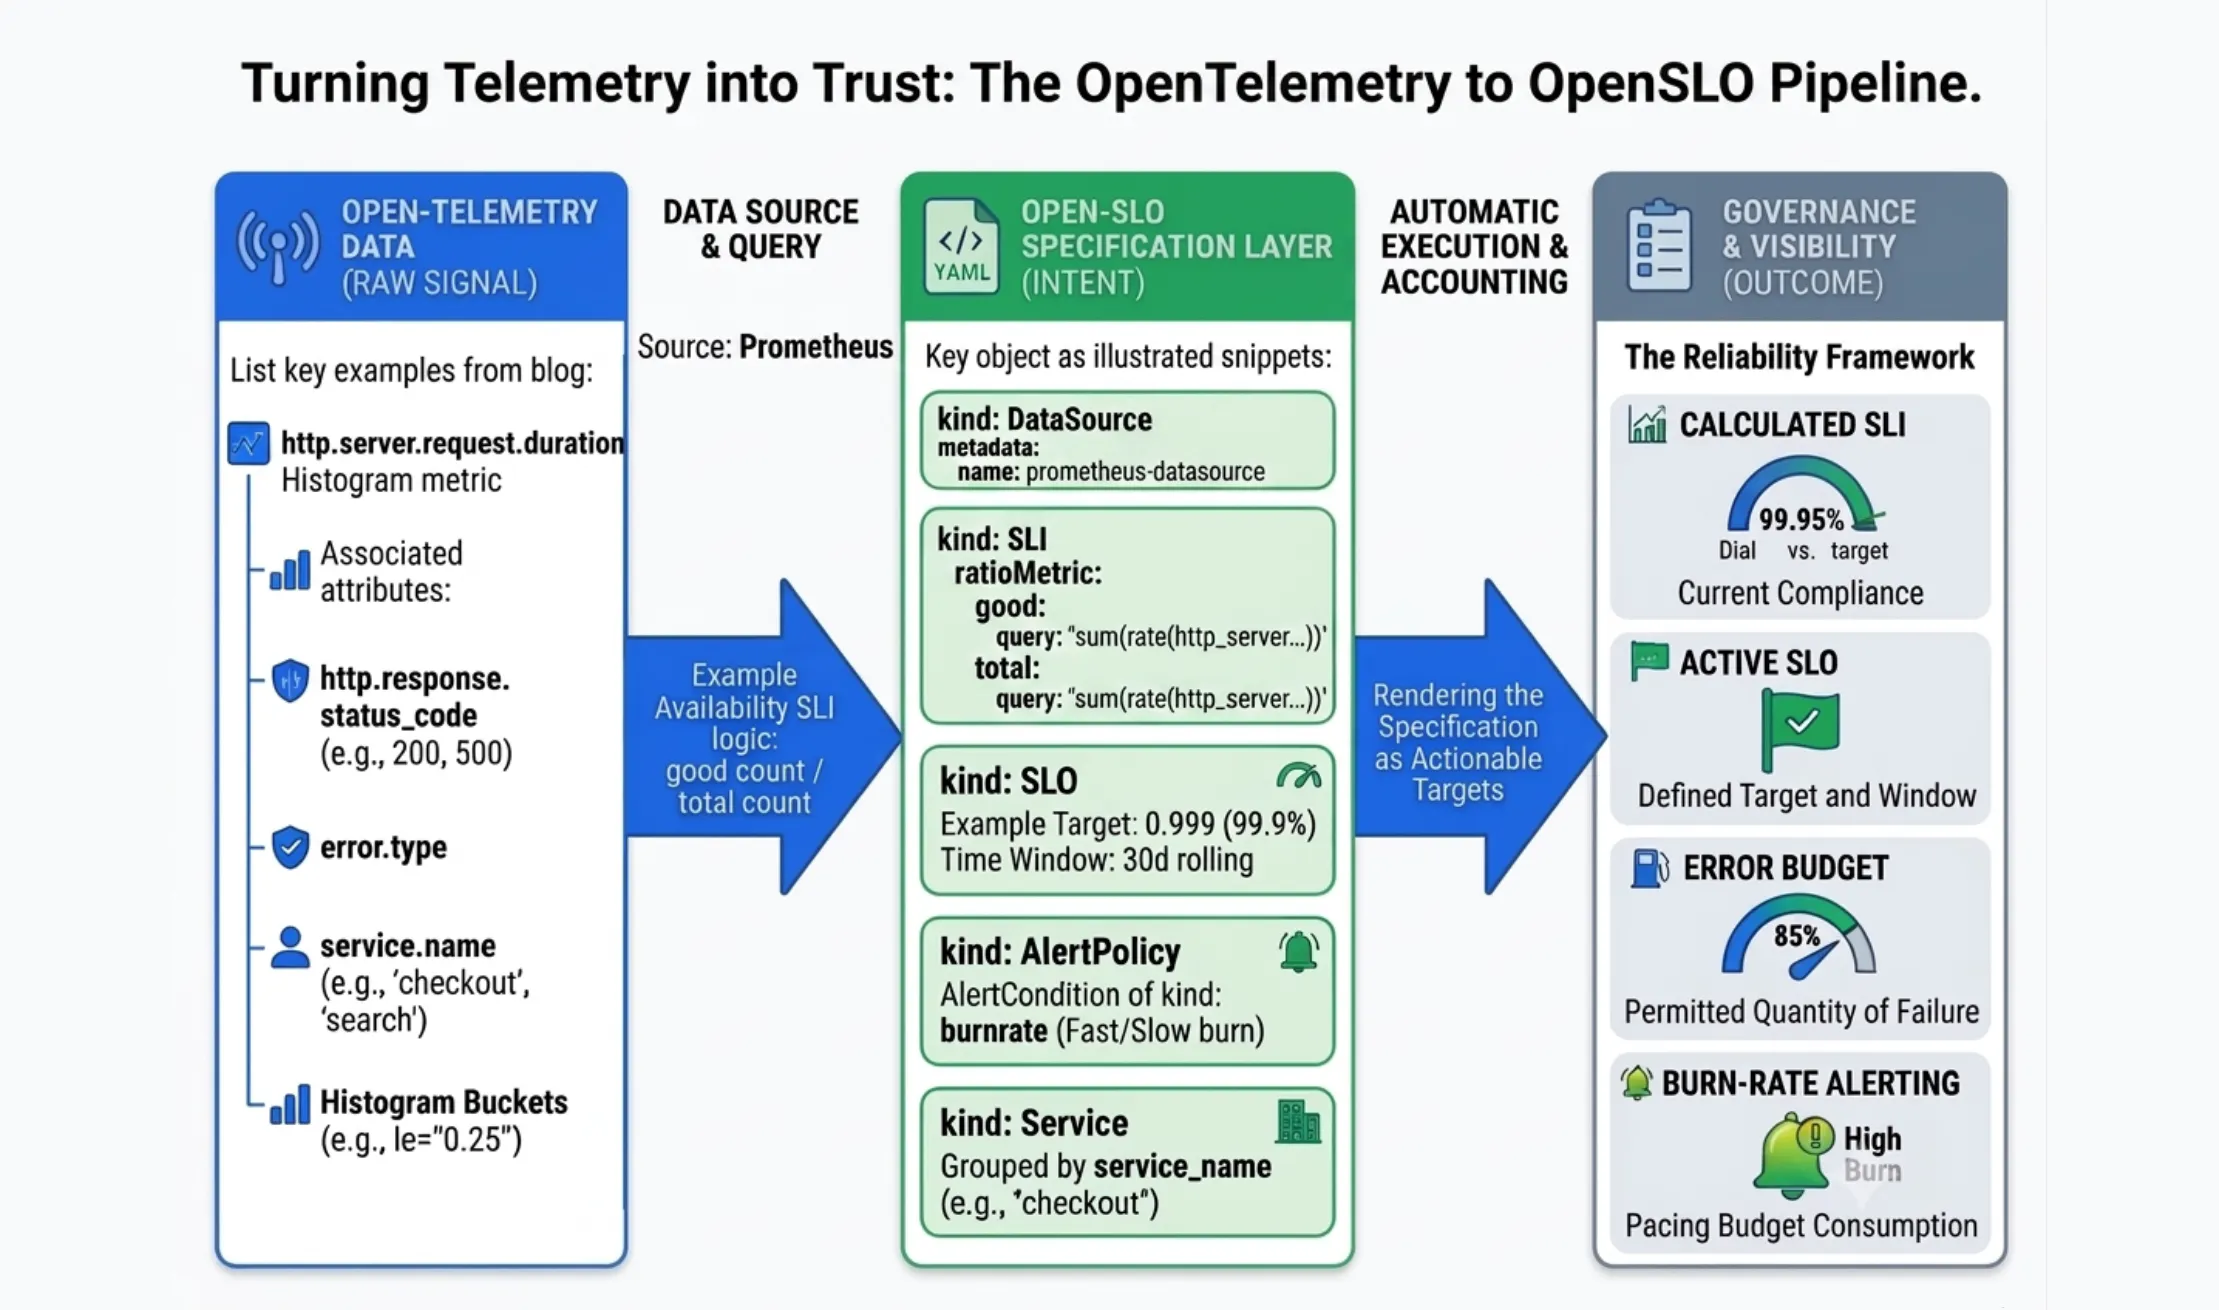
OpenSLO is an open vendor neutral specification for expressing service level objectives as code. It follows the Kubernetes YAML conventions, so it reads as familiar from the first line to anyone who has operated modern infrastructure. You describe a small set of objects: a Service, an SLI, an SLO and, where you need them, DataSource, AlertPolicy and AlertCondition objects. Because the definitions are plain YAML they live in version control, move through pull requests and are reviewed with the same rigor as the code they govern.
The division of responsibility is clean and worth stating plainly to any stakeholder. OpenTelemetry tells you what is happening. OpenSLO tells you what should be happening and by how much you are permitted to fall short. One is observation. The other is intent.
The OpenTelemetry to OpenSLO Implementation Guide:
Step one: Confirm the telemetry can carry an indicator
Before authoring any objective, confirm that your metrics carry the attributes needed to separate good events from bad. An availability indicator requires a request count you can filter by status code or error type. A latency indicator requires a histogram such as http.server.request.duration so requests under a threshold can be counted using the bucket boundaries. This is a five minute audit that prevents weeks of disagreement later.
The readiness criteria I hold teams to:
- Requests are counted under a stable consistent metric name
- Responses carry a status code or error type as an attribute
- Latency is recorded as a histogram with sensible bucket boundaries
- Every service sets service.name so ownership and grouping are unambiguous
Step two: Select indicators that reflect the customer
Choose indicators that mirror what your customers actually experience rather than what is convenient to measure. Make sure to cover the majority of services. Availability is the share of requests that did not fail, where good events are requests without a server error and total events are all requests. Latency is the share of requests served faster than a threshold, where good events are requests in the histogram buckets at or below your target of, say, 250 milliseconds and total events are all requests. Resist the temptation to add more. A small number of indicators that everyone understands will outperform a sprawling catalog that nobody trusts.
Both map directly onto the OpenSLO ratioMetric object. In the OpenSLO specification, a ratioMetric is a built-in function designed to calculate percentage-based health. It expects a good query (e.g., successful requests) and a total query (all incoming traffic), and automatically divides the good by the total to compute your live service health indicator..
Step three: Author the OpenSLO objects
Begin by pointing OpenSLO at the store that holds your OpenTelemetry metrics.
apiVersion: openslo/v1
kind: DataSource
metadata:
  name: prometheus-otel
spec:
  type: Prometheus
  connectionDetails:
    url: http://prometheus.monitoring:9090
Declare the service so that objectives have a clear owner to attach to.
apiVersion: openslo/v1
kind: Service
metadata:
  name: checkout
  displayName: Checkout Service
spec:
  description: Handles cart and payment requests
This availability SLI reads directly from your OpenTelemetry metrics inside Prometheus. Across all OTel histograms, Prometheus automatically generates a count suffix series to track total event volume. We use this suffix to establish our total traffic baseline, while filtering out 5xx server errors (httpresponse_status_code!~"5..") isolates our successful "good" requests.
apiVersion: openslo/v1
kind: SLI
metadata:
  name: checkout-availability
spec:
  description: Share of checkout requests without a server error
  ratioMetric:
    counter: true
    good:
      metricSource:
        metricSourceRef: prometheus-otel
        type: Prometheus
        spec:
          query: sum(rate(http_server_request_duration_seconds_count{
            service_name="checkout",
            http_response_status_code!~"5.."}[5m]))
    total:
      metricSource:
        metricSourceRef: prometheus-otel
        type: Prometheus
        spec:
          query: sum(rate(http_server_request_duration_seconds_count{
            service_name="checkout"}[5m]))
Finally, the objective binds the indicator to a target and a window. This is the commitment your organization is making, written down where it can be reviewed and enforced.
apiVersion: openslo/v1
kind: SLO
metadata:
  name: checkout-availability-slo
  displayName: Checkout Availability
spec:
  service: checkout
  indicatorRef: checkout-availability
  timeWindow:
    - duration: 30d
      isRolling: true
  budgetingMethod: Occurrences
  objectives:
    - displayName: 99.9% successful
      target: 0.999
That is a complete production-ready objective built entirely from OpenTelemetry data. A latency indicator follows the same pattern. The good query counts the histogram buckets at or below your threshold and the total query counts every request.
good query:
  sum(rate(http_server_request_duration_seconds_bucket{
    service_name="checkout", le="0.25"}[5m]))

total query:
  sum(rate(http_server_request_duration_seconds_count{
    service_name="checkout"}[5m]))
Step four: Render the specification as dashboards
Once the OpenSLO definitions exist, a compatible tool reads them and generates the operational surface: recording rules that compute the indicator, a panel for current compliance, a panel for remaining error budget and a burn-rate view. Because the mathematics resides in the specification, every dashboard tells one consistent story. The era of copying PromQL between Grafana panels and hoping the figures reconcile is over. With it goes an entire class of avoidable incidents caused by inconsistent definitions.
A dashboard worth presenting to leadership conveys four things at a glance:
- The current indicator value measured against the target
- The error budget remaining for the window
- The burn rate, meaning the pace at which the budget is being consumed
- A recent trend so a slow regression is caught before it becomes an incident
All four derive from the same OpenSLO definition, which gives the organization a single authoritative source rather than four subtly different queries that disagree under pressure.
Step five: Alert on burn rate, not on noise
Raw metric alerts tend to fire on a single transient spike that resolves itself moments later, which trains responders to ignore them. Burn-rate alerting asks the question that matters: are we consuming the error budget quickly enough to exhaust it before the window closes? OpenSLO expresses this intent directly with an AlertCondition and an AlertPolicy.
apiVersion: openslo/v1
kind: AlertCondition
metadata:
  name: fast-burn
spec:
  severity: page
  condition:
    kind: burnrate
    op: gte
    threshold: 14.4
    lookbackWindow: 1h
    alertAfter: 5m
Bind that condition to a policy that notifies your on-call target and the result is alerting that tracks genuine customer impact rather than every passing fluctuation. A high burn rate over a short window signals trouble in progress. A lower burn rate over a longer window surfaces the slow leaks that quietly erode a quarter. Both protect the budget, and both protect the credibility of your paging.
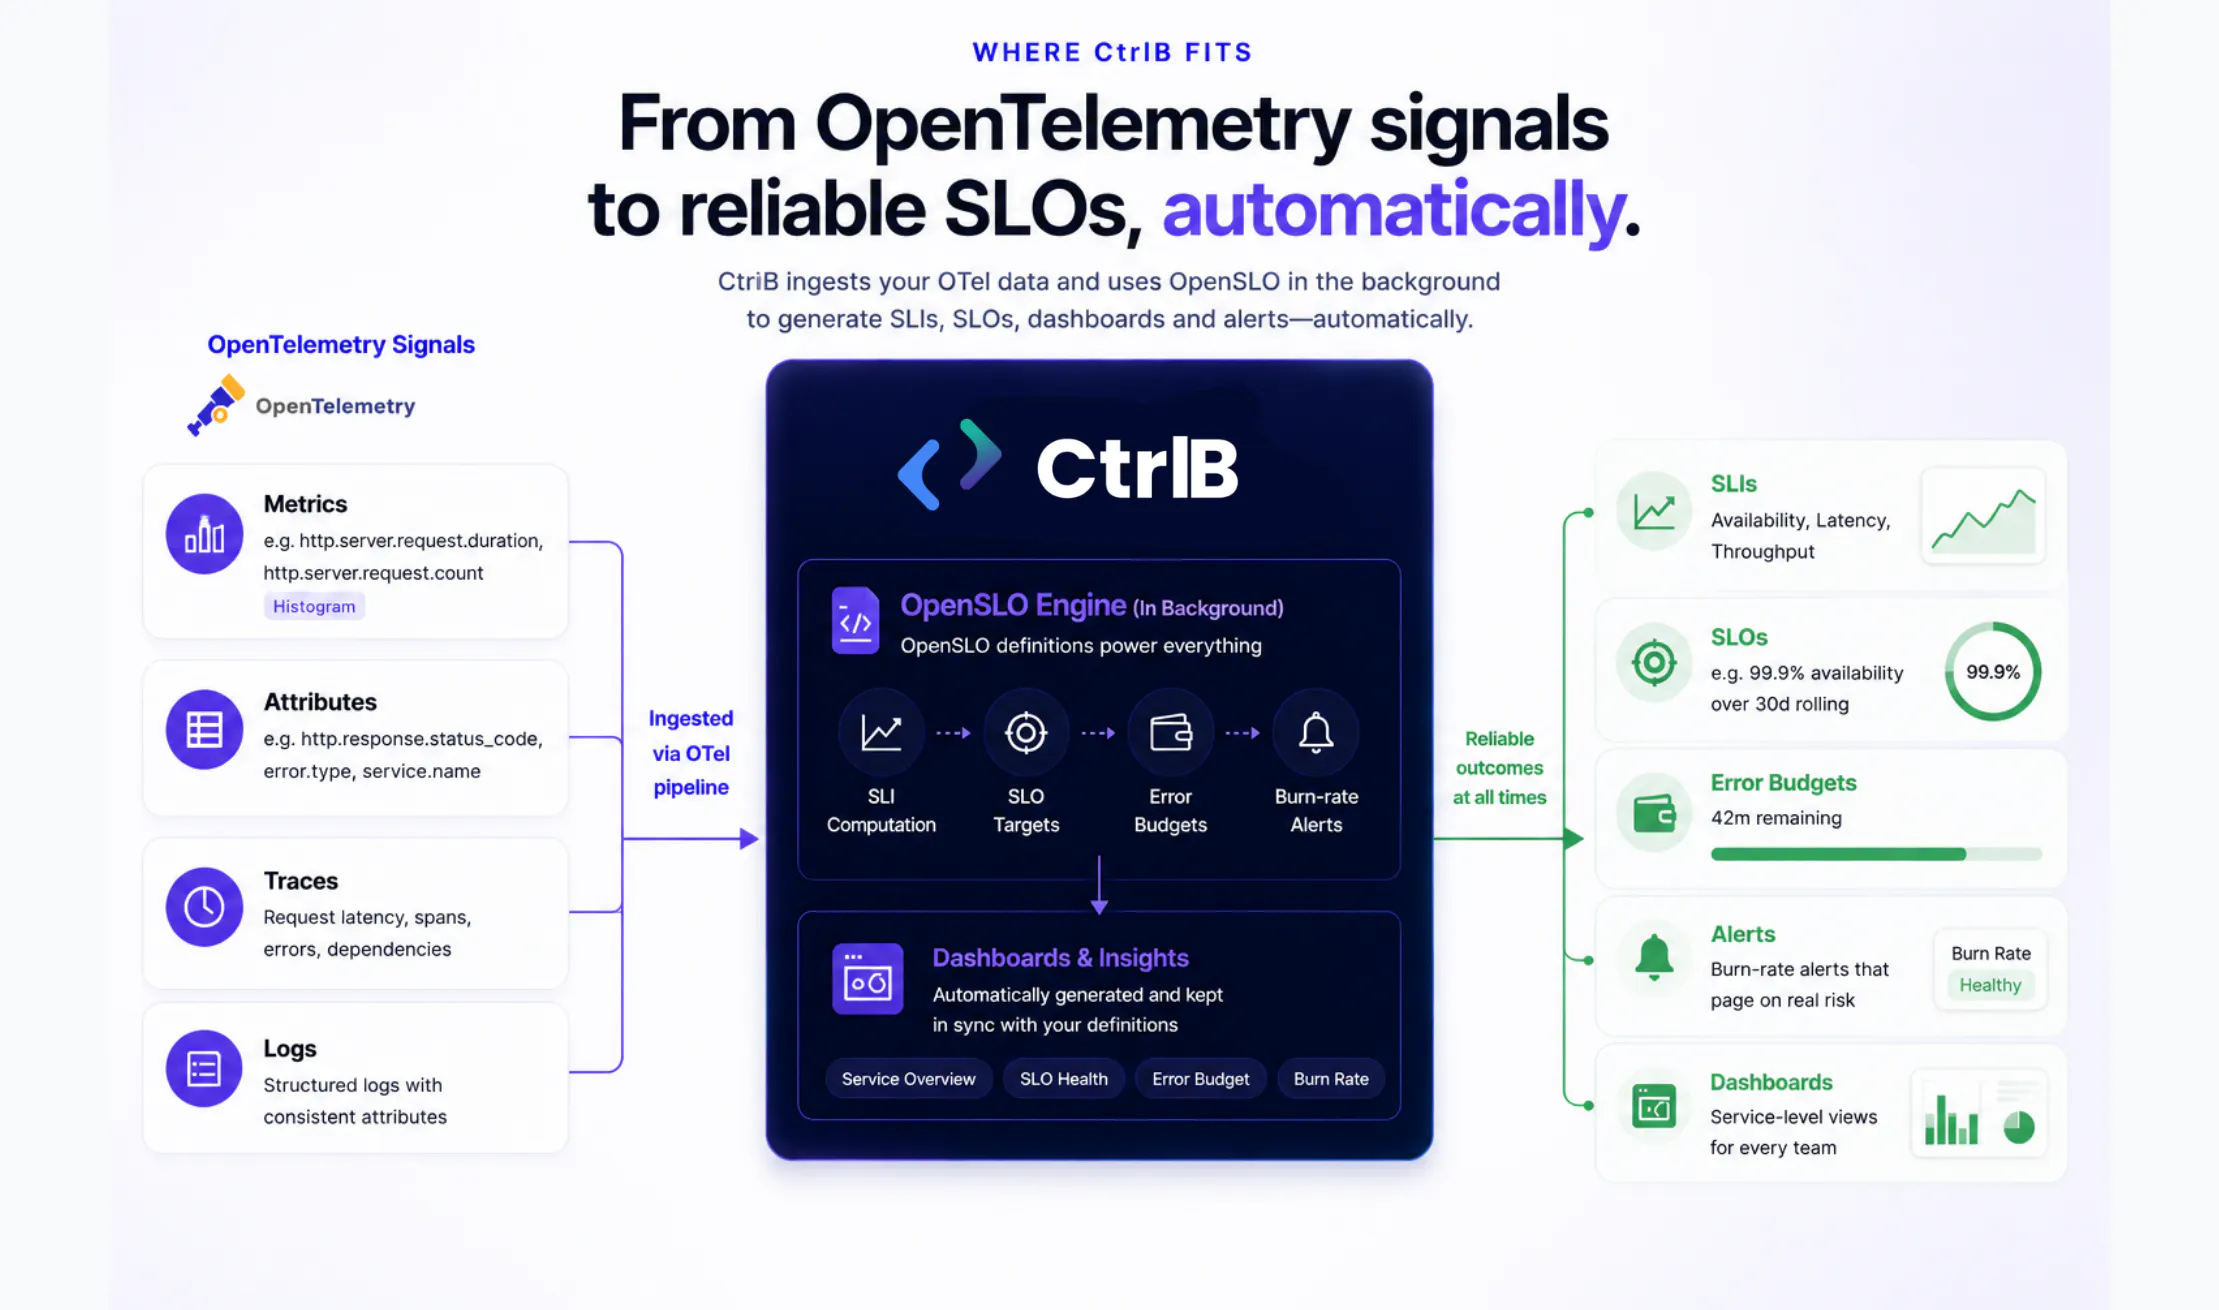
Where CtrlB fits
Assembling this by hand is entirely possible. Many capable teams do. What it demands is sustained discipline to keep queries, dashboards and alerts synchronized as services evolve, ownership changes and definitions drift. That maintenance burden is where most reliability programs quietly lose momentum. CtrlB is built for OpenTelemetry-native organizations to remove exactly that burden. It reads your existing OTel pipeline directly, so nothing has to be re-instrumented. You express indicators and objectives in the OpenSLO style, CtrlB generates the indicator and error-budget dashboards and it holds your burn-rate alerts in lockstep with the same definitions. The outcome is one authoritative place where telemetry, targets and alerts agree, by construction rather than by vigilance.
If your services already emit OpenTelemetry data then the hardest work is behind you. Point CtrlB at your pipeline, articulate what good looks like and let the platform render the reliability picture your engineers and your executives can both act on.
Ready to turn your OpenTelemetry investment into reliability targets the whole organization trusts?
Connect CtrlB to your pipeline or speak with our team and see your first SLO dashboard live within minutes.