Incident work is narrow and impatient. You look up one trace identifier, match one error substring, or isolate a single short-lived container session, and the answer has to come back in milliseconds. Dashboards and capacity reviews ask for the opposite: scan billions of records across long time ranges to compute averages, percentiles, and multi-key aggregations.
To find out whether one engine can serve both patterns without giving ground on either, we ran two standard benchmark suites, one for each kind of search:
- Analytical search: the official public ClickBench suite, all 43 standard SQL queries, run against the analytical engines on the public leaderboard.
- Full-text search: 8 selective needle-in-a-haystack patterns over 5 TB of raw logs, run against ClickHouse v26.2 on cold cache.

Section 1: Analytical Search Performance on ClickBench
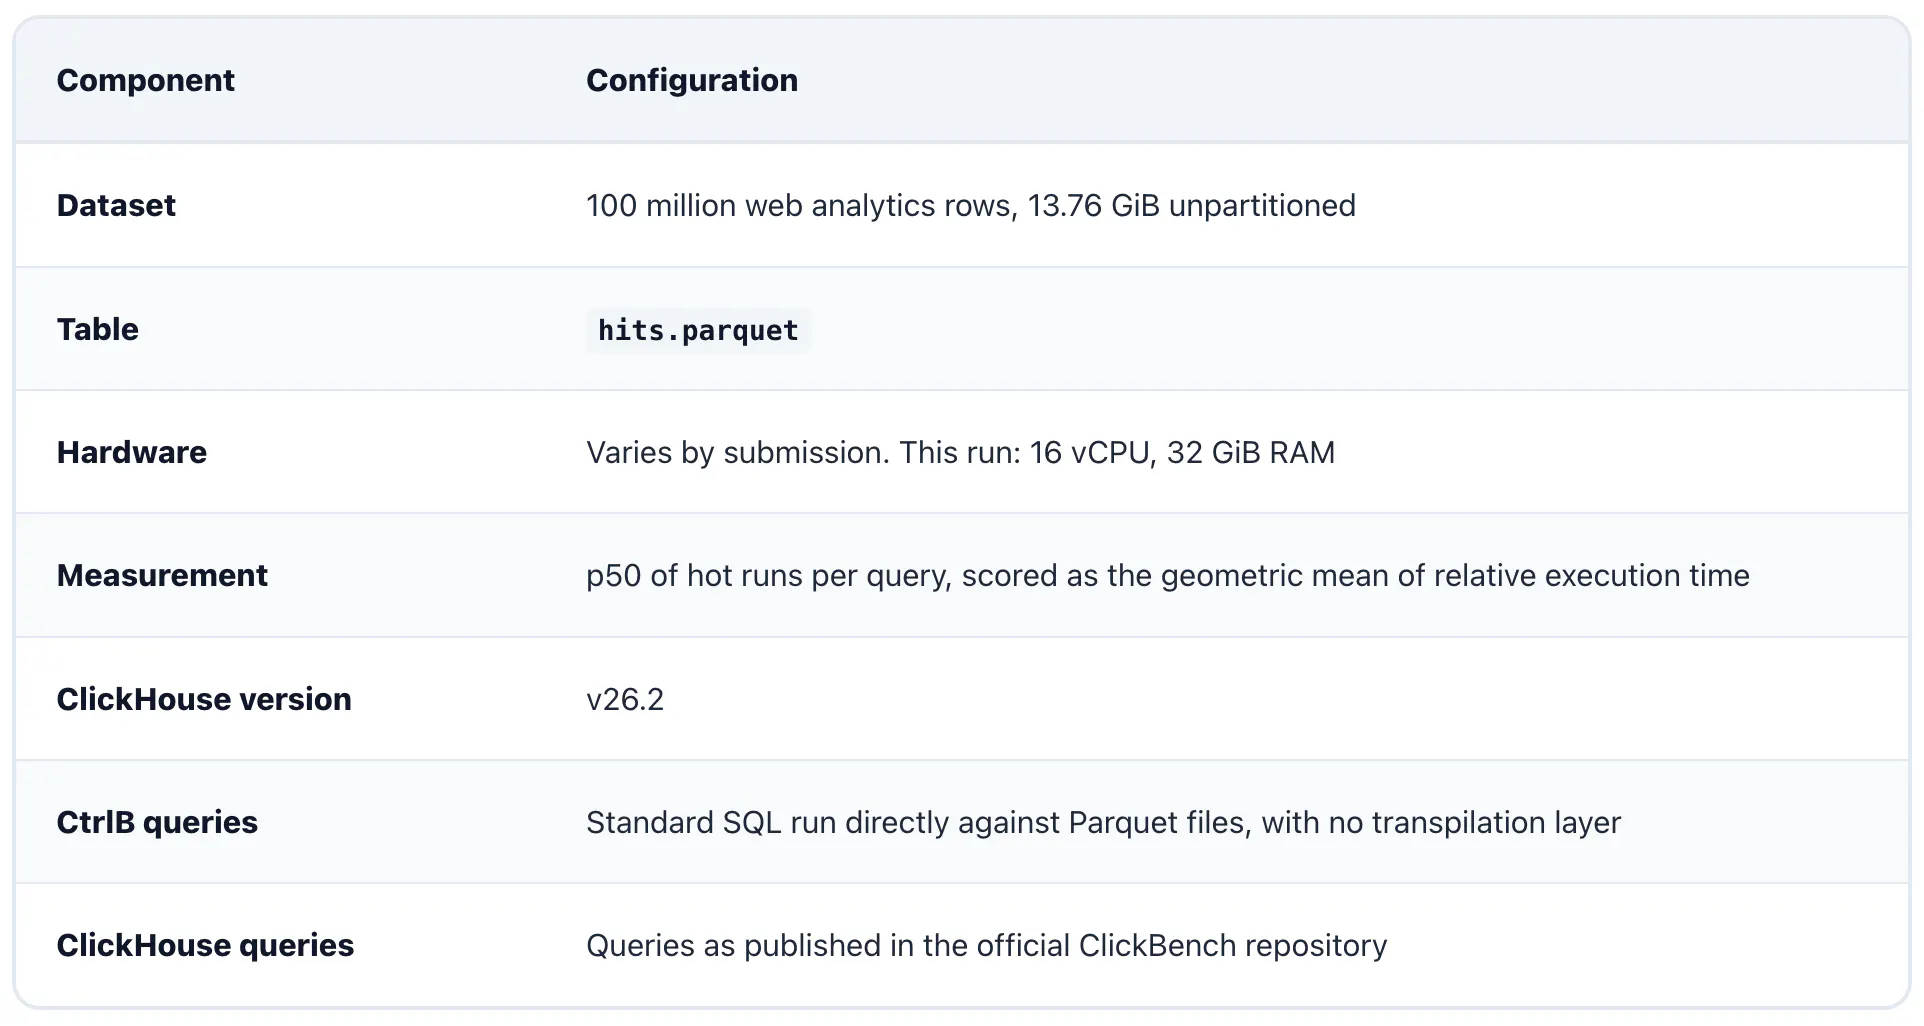
ClickHouse built ClickBench as an open, reproducible way to compare analytical query processing across data lake and relational systems. The suite runs 43 queries over an unpartitioned 100-million-row web analytics dataset and covers table scans, range aggregations, multi-key GROUP BY expressions, string transformations, and high-cardinality ranking.
Analytical Search Test Environment
Hardware, dataset, and query configuration for the 43-query analytical search run:
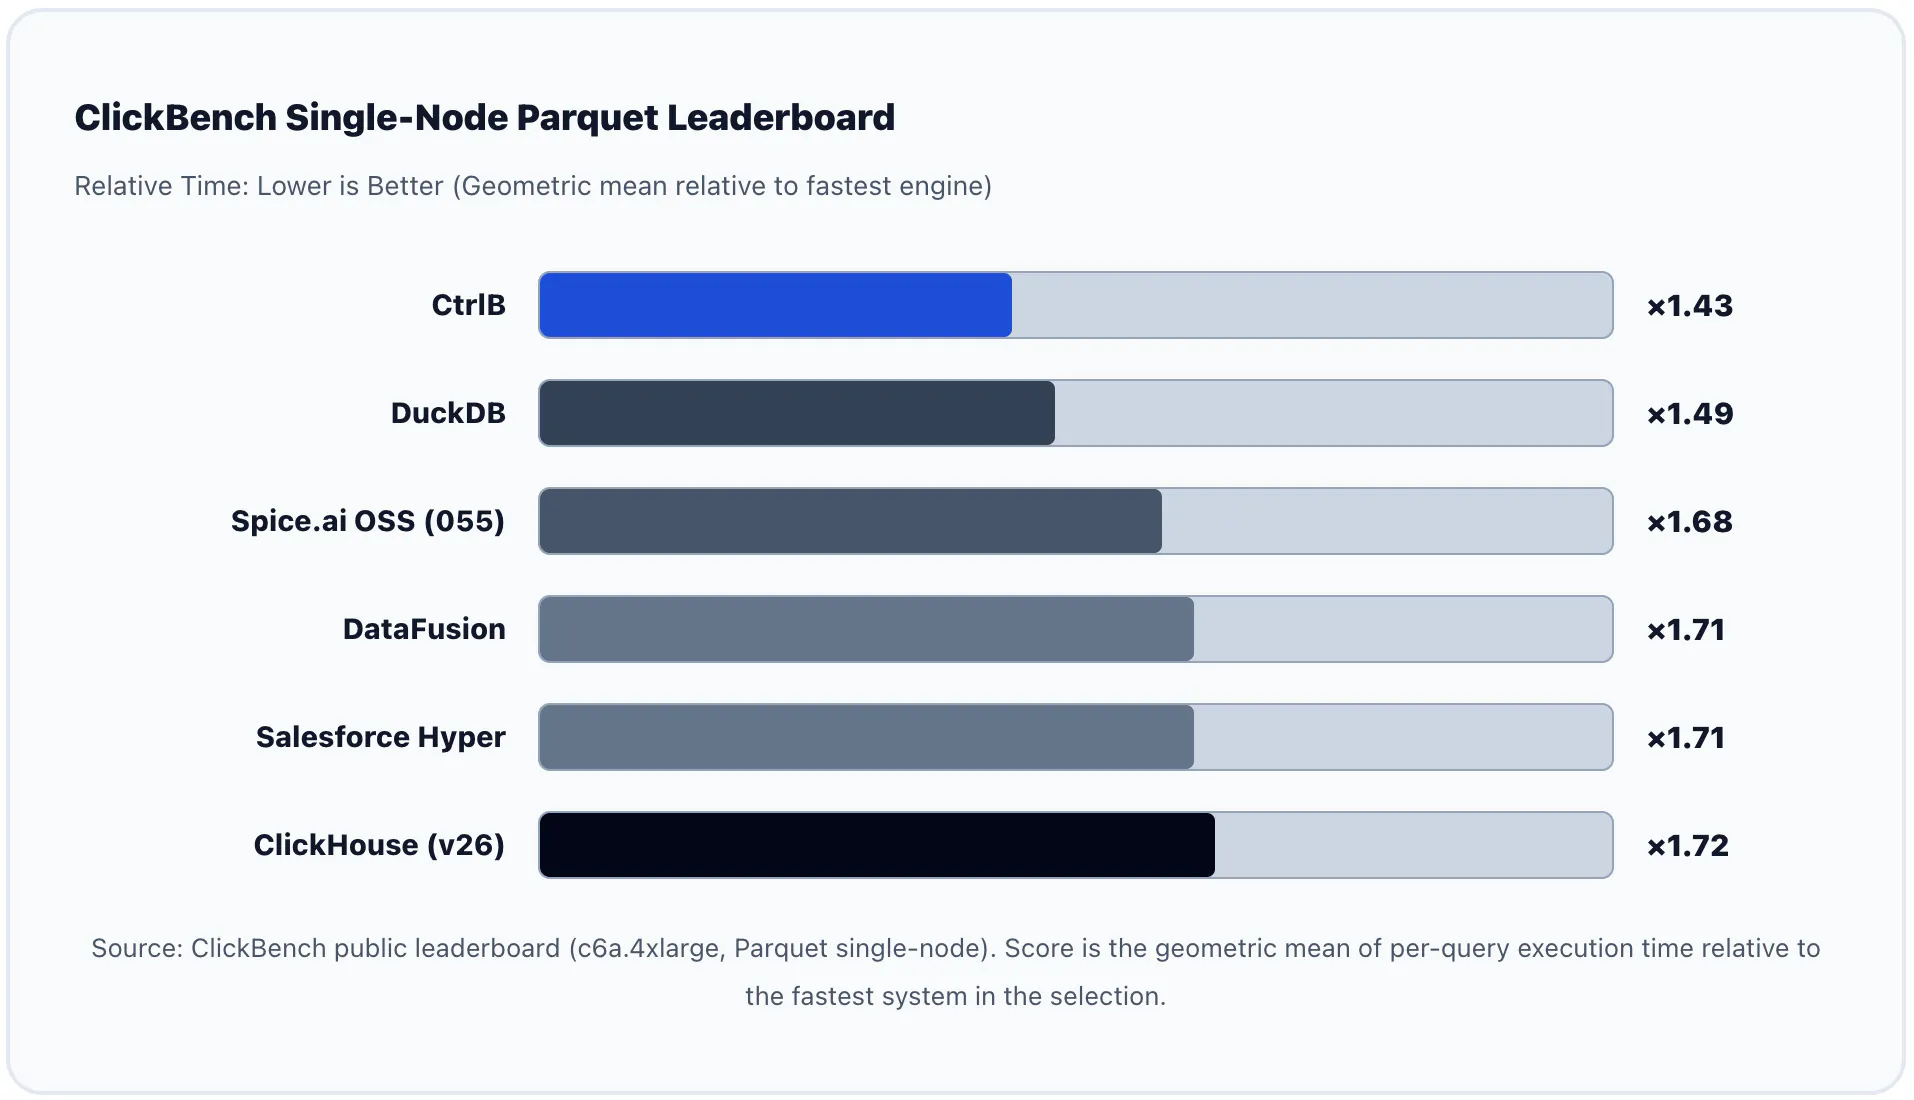
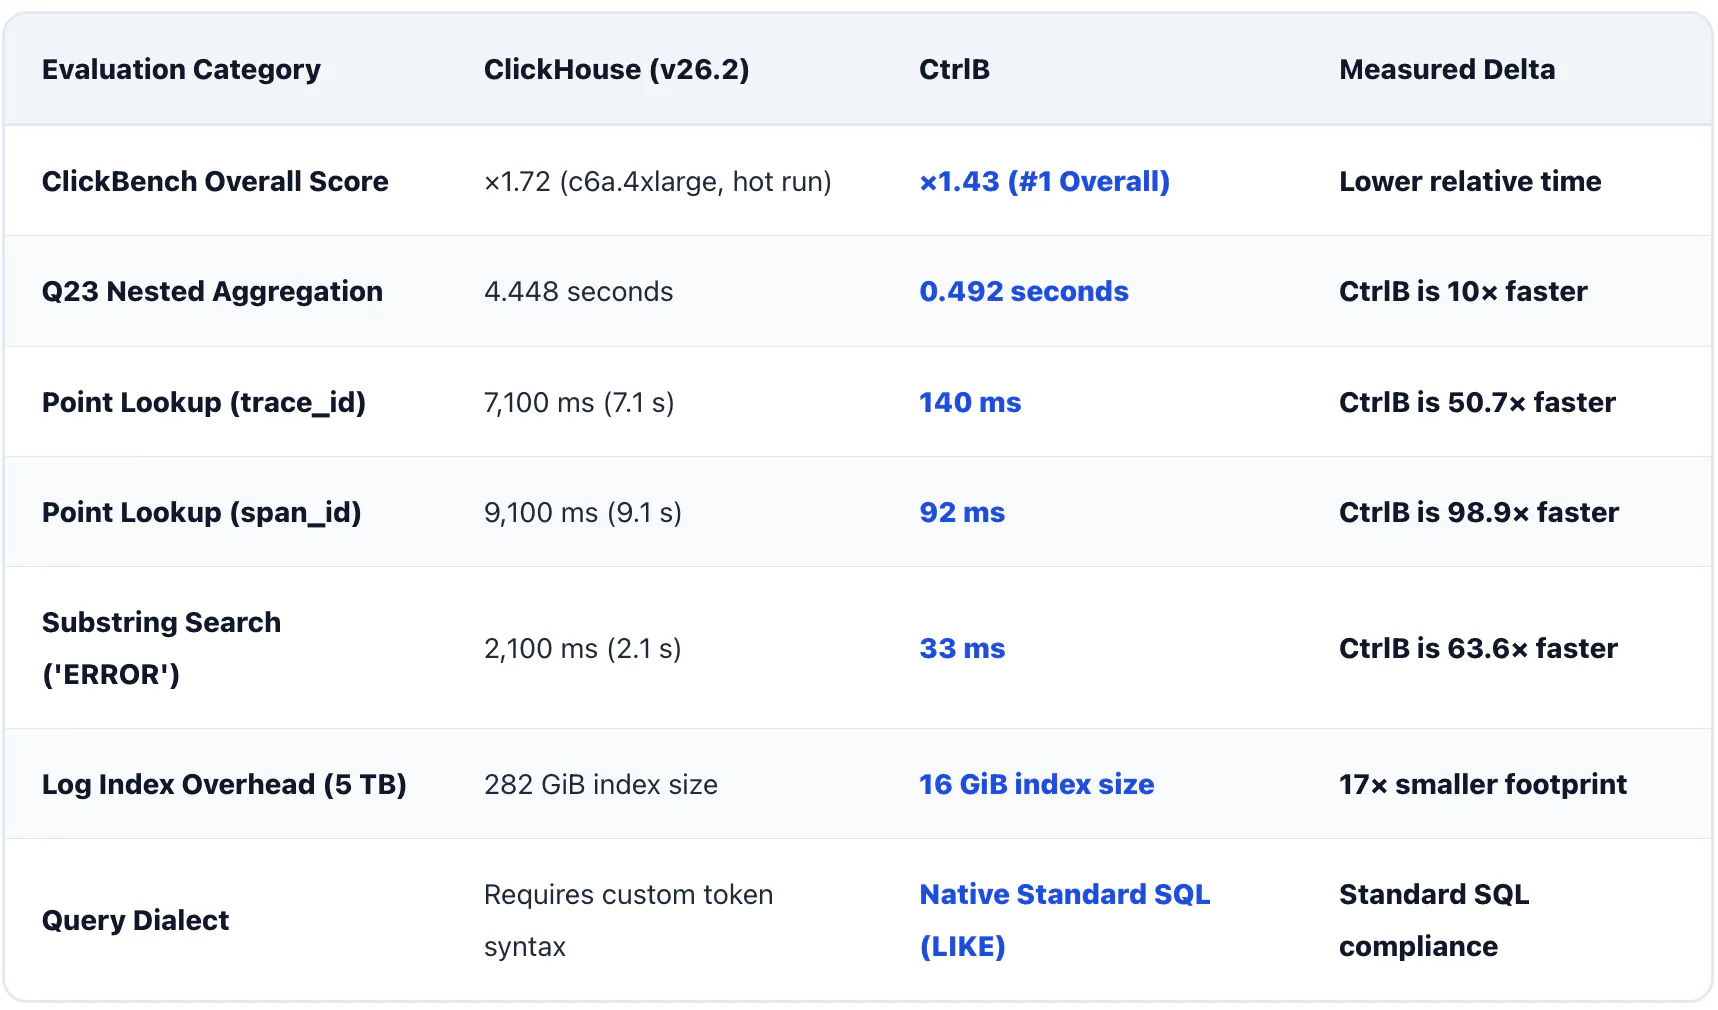
On its first submission, CtrlB scored ×1.43 and took the #1 position on the single-node Parquet leaderboard. That is a lower relative time across the 43 queries than DuckDB (×1.49), DataFusion (×1.71), and ClickHouse itself (×1.72).
Analytical Search: Query by Query Breakdown
Timings and relative factors for a representative set of the query patterns in the suite:
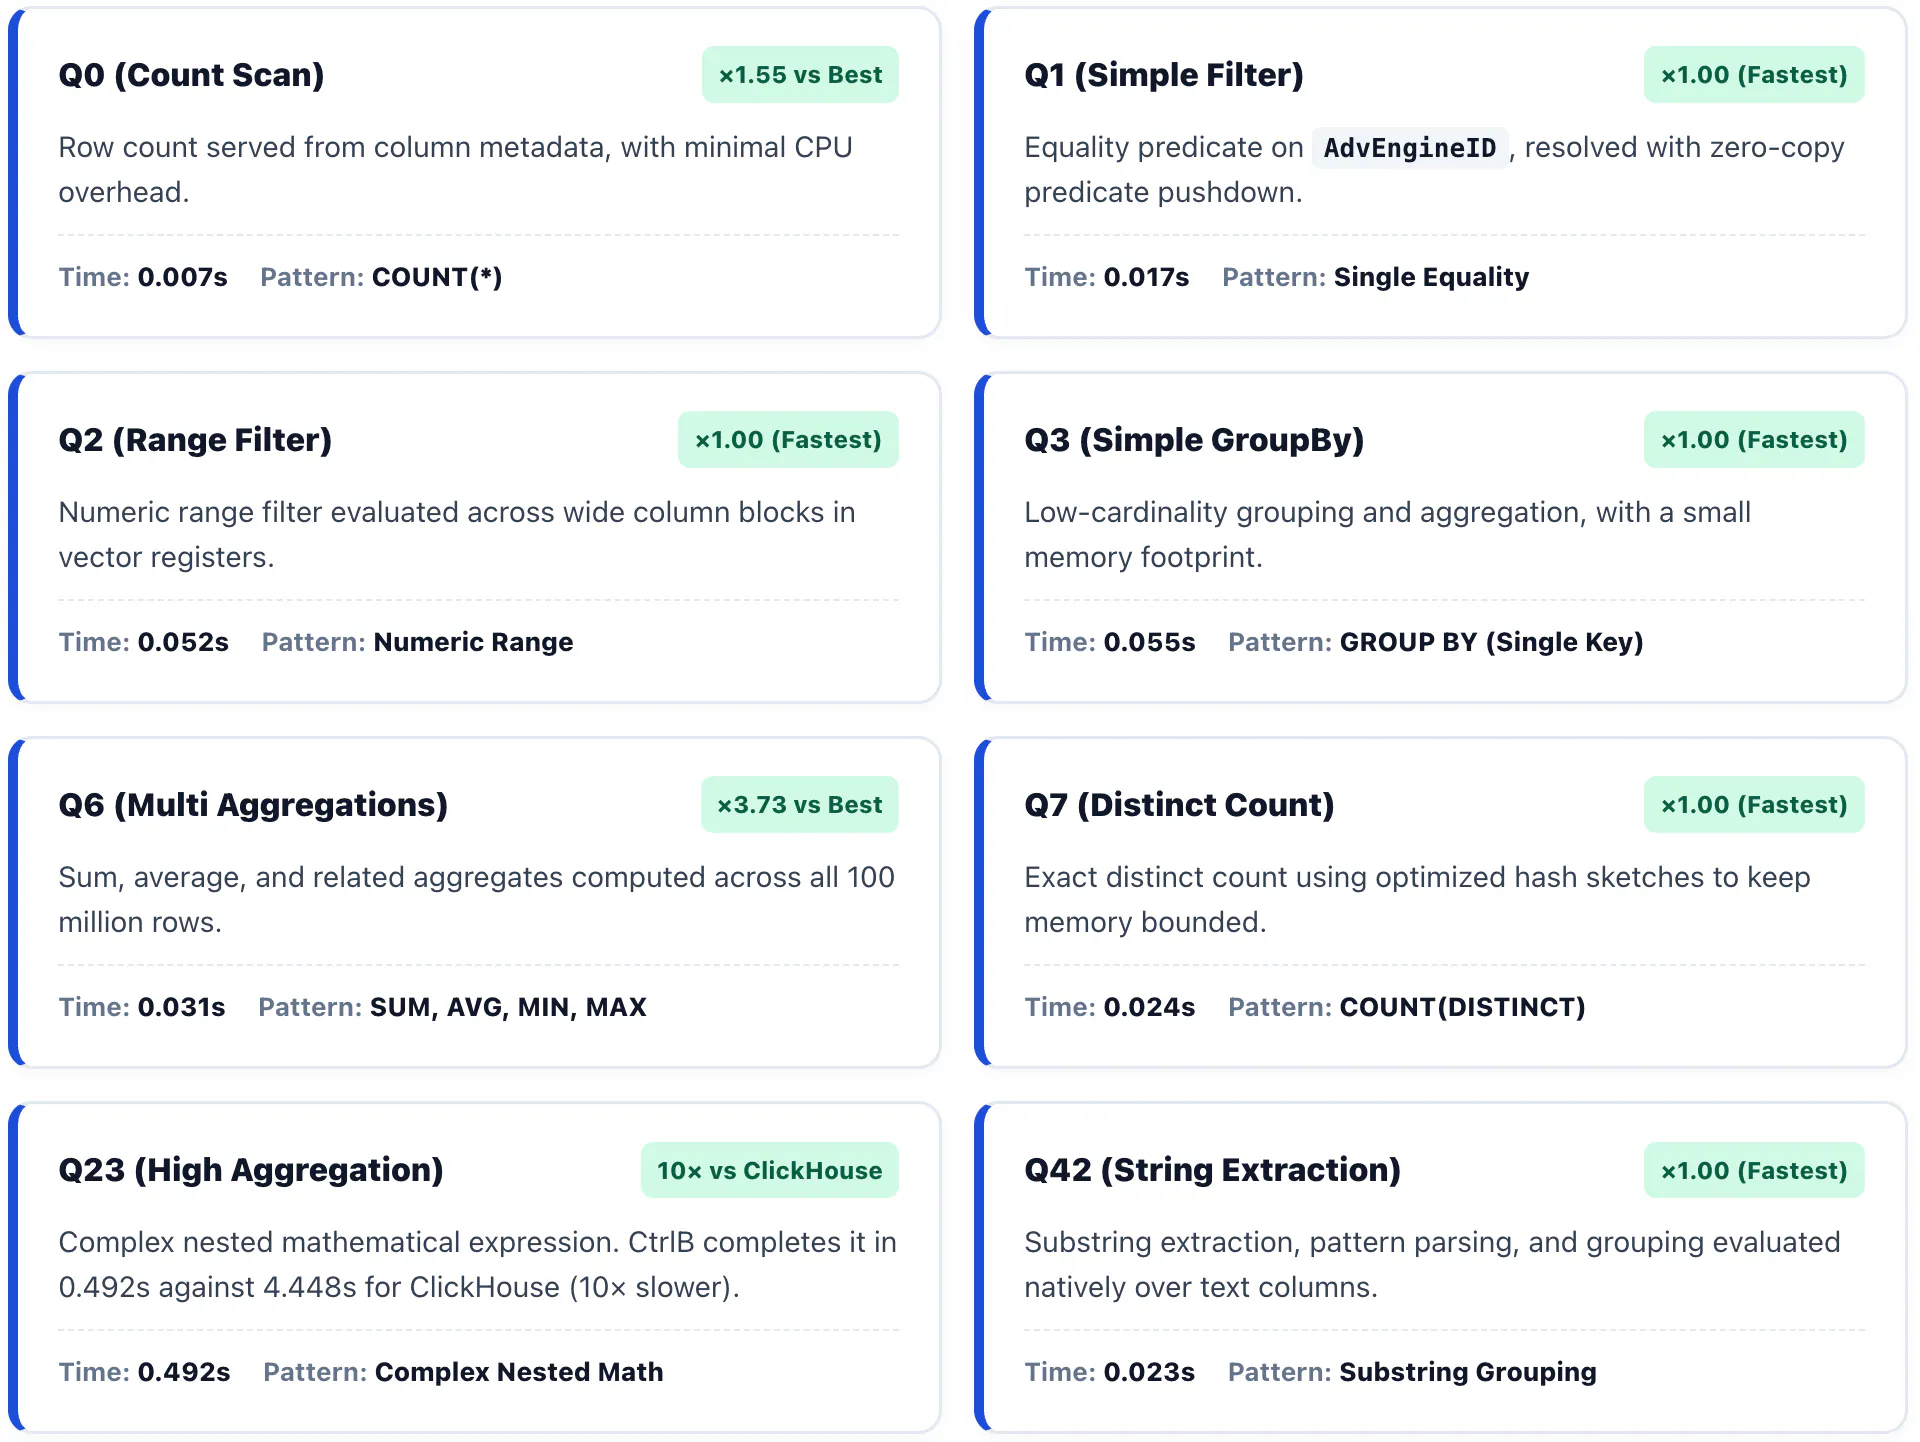
Q23 shows the largest gap among the queries above. CtrlB completes the nested mathematical expression in 0.492 seconds against 4.448 seconds for ClickHouse, a ten-fold difference on an analytical query from ClickHouse's own test suite.
Section 2: Full-Text Search Across 5 TB of Logs
Analytical search is only half of what a telemetry store has to do. Full-text search is the other half: isolating a specific trace_id, a rare token, or a combination of filters without reading the whole table.
Full-Text Search Test Environment
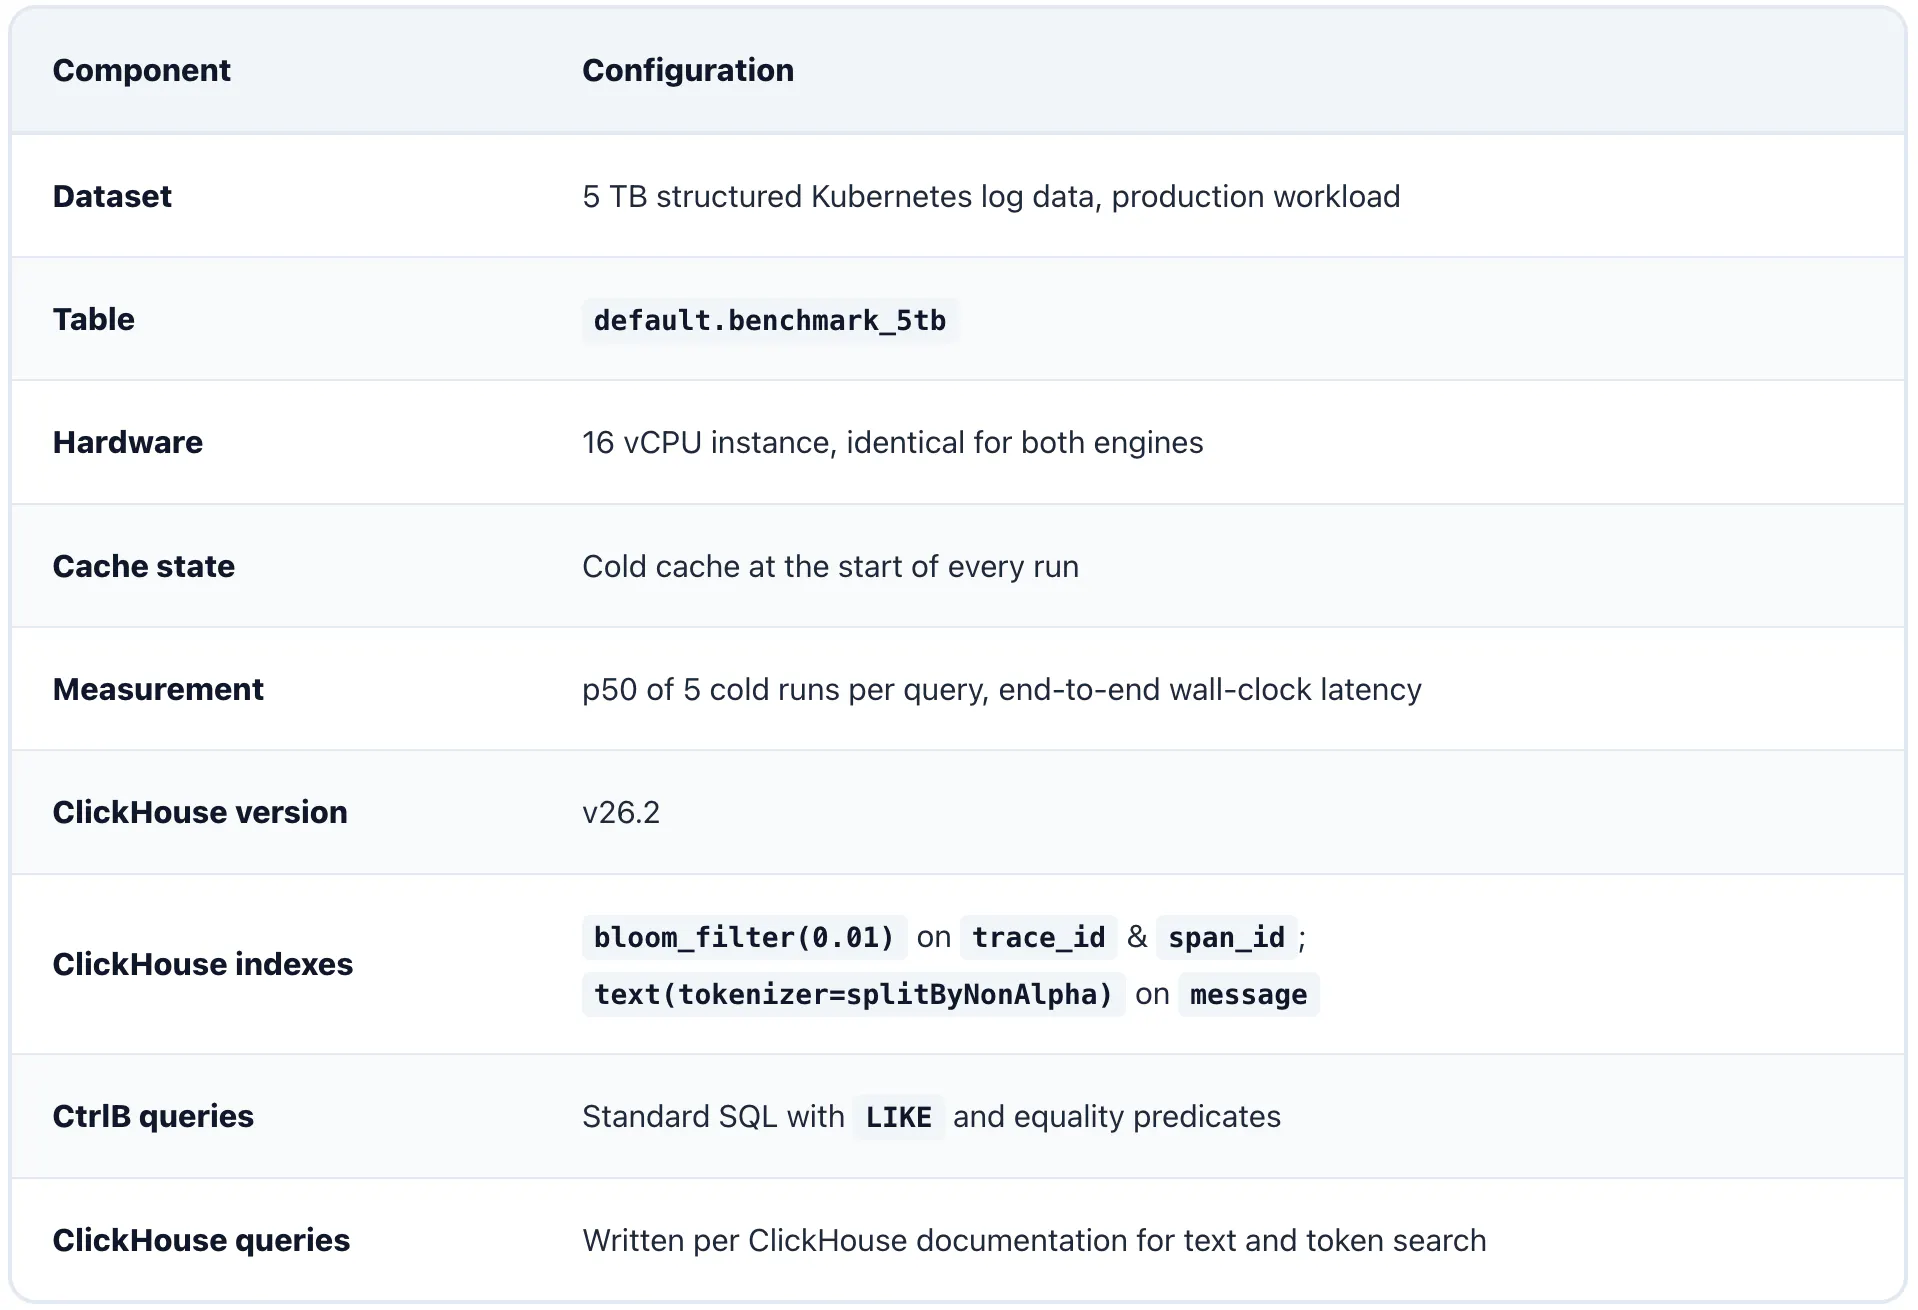
Environment, index definitions, and measurement rules for the 5 TB cold-cache full-text search runs:
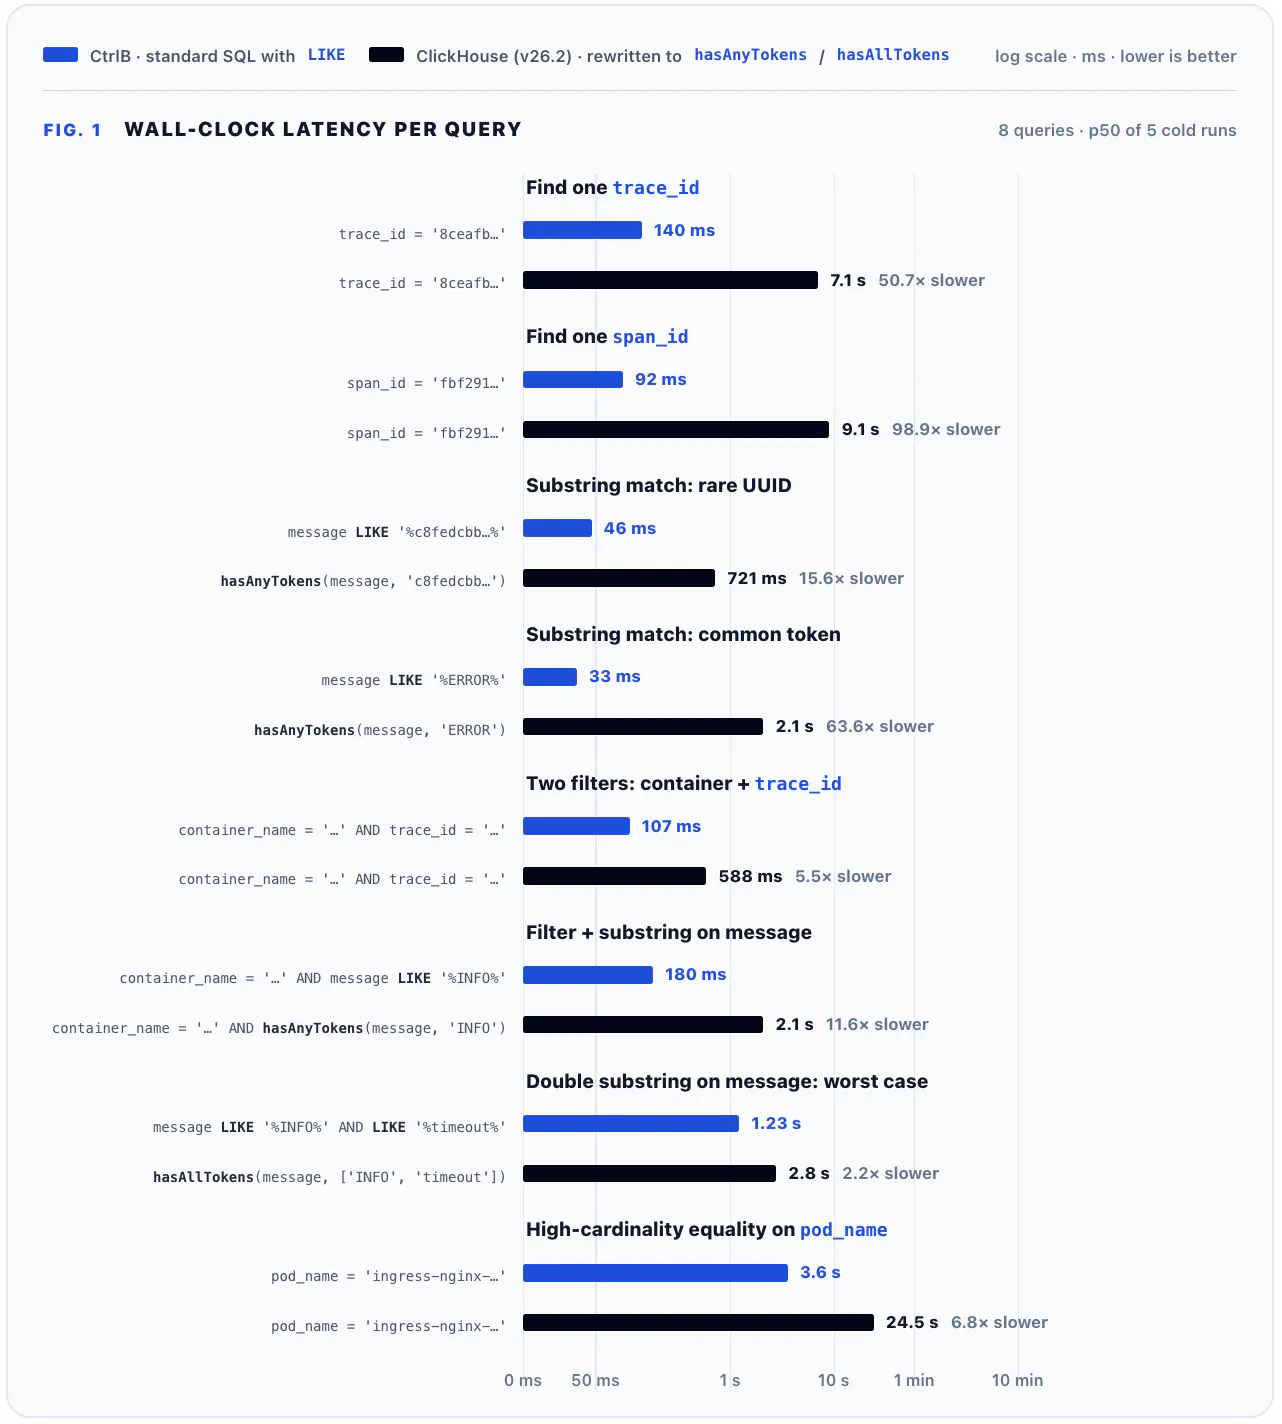
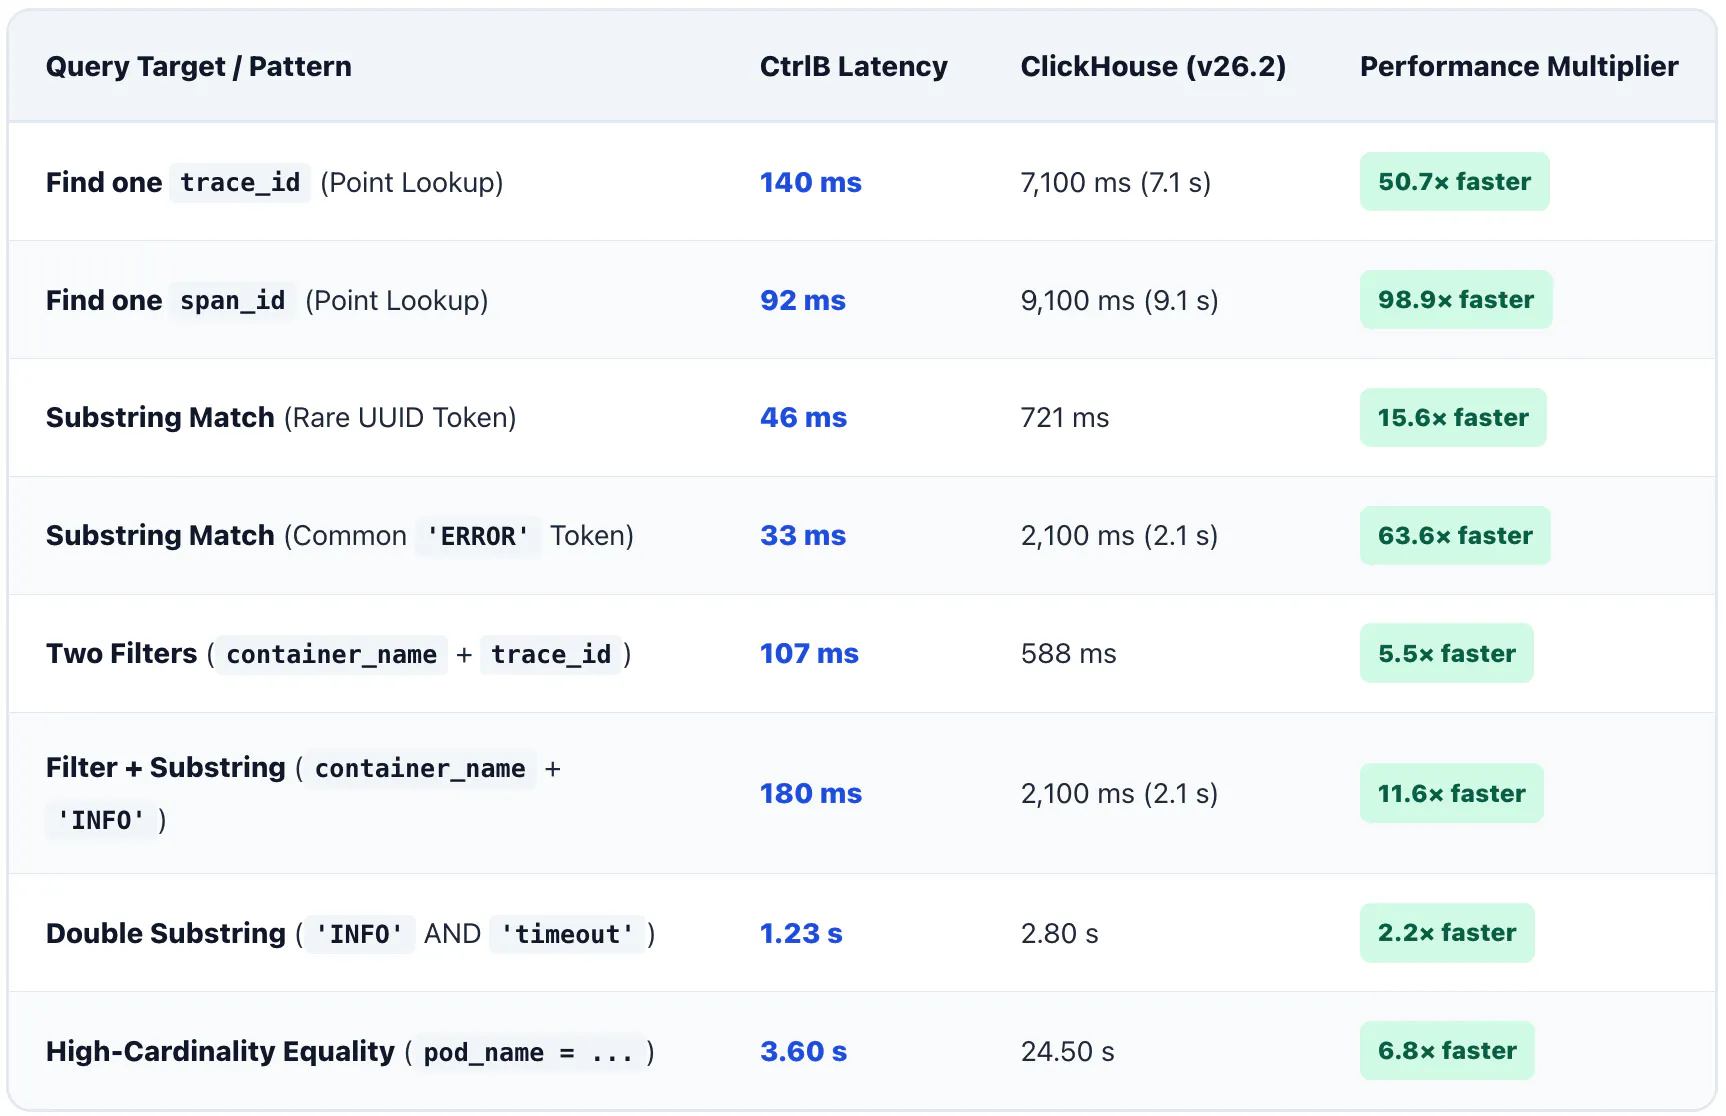
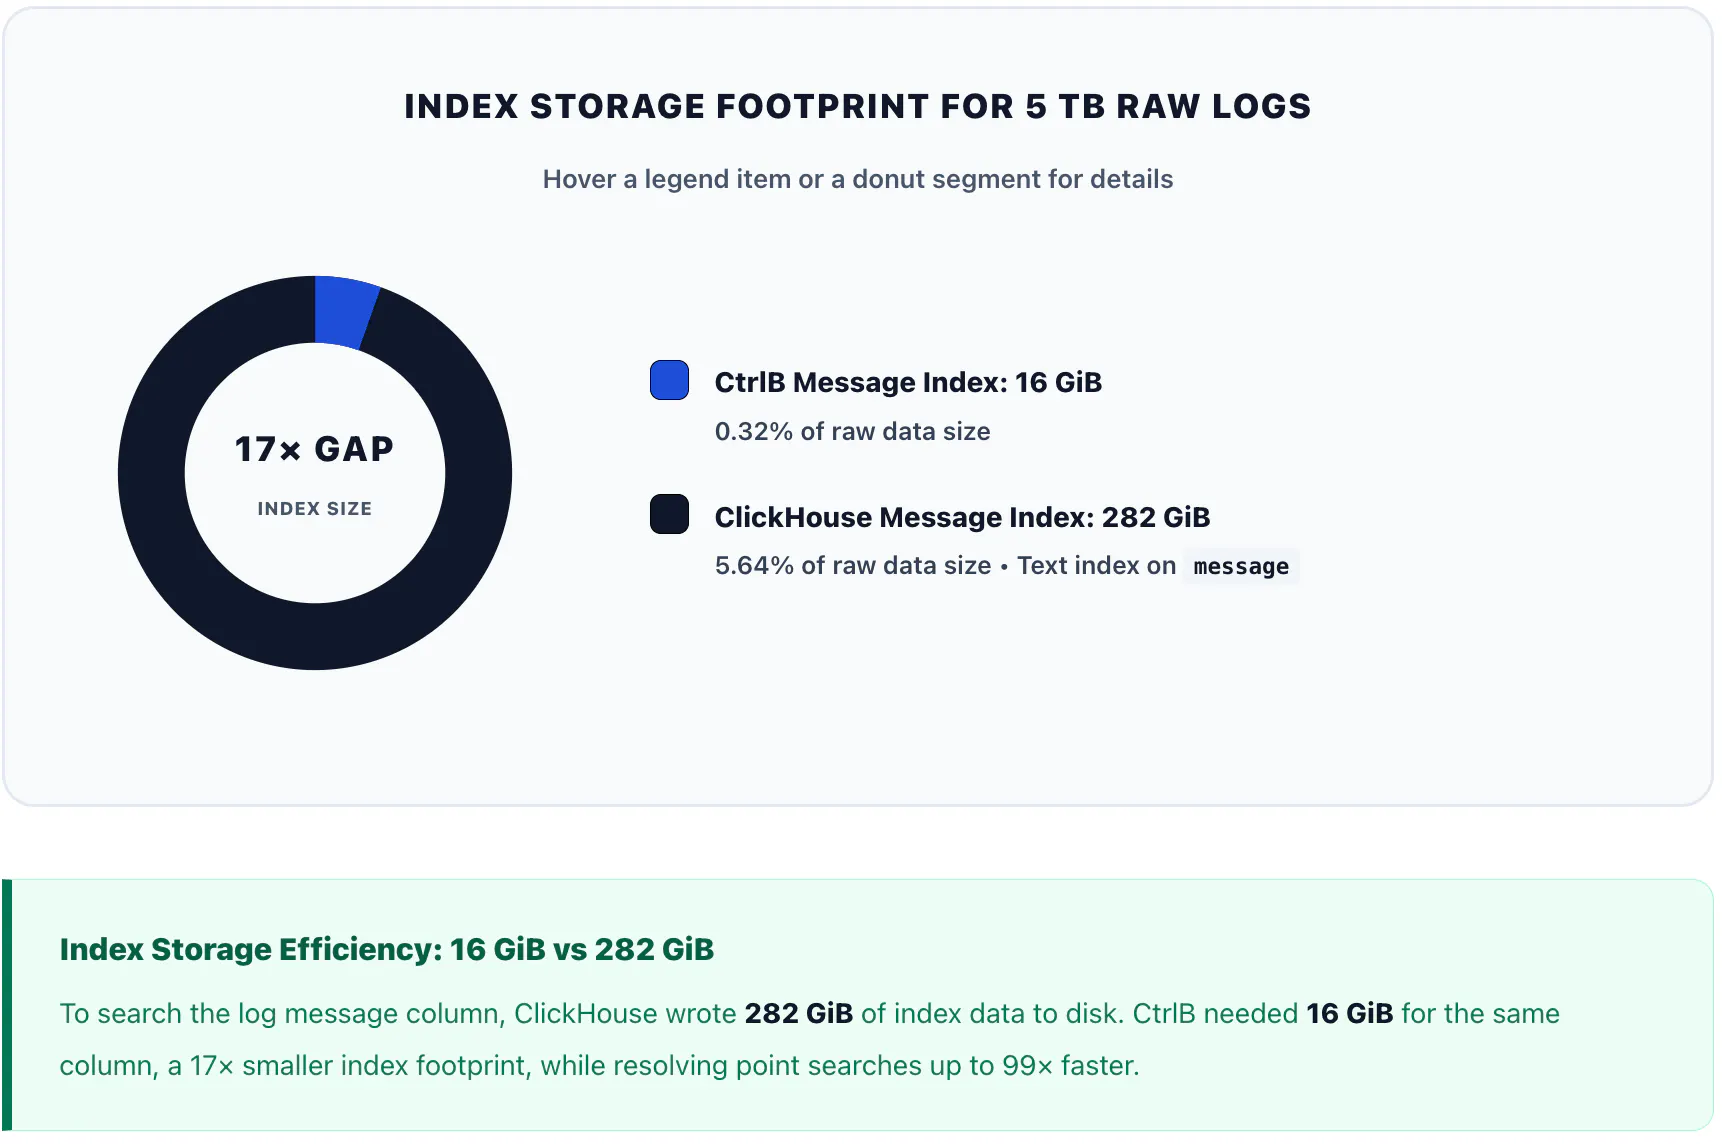
We ran eight full-text search queries, point lookups and substring matches, against ClickHouse v26.2 on cold cache, each a standard WHERE ... LIMIT 100. The spread is wide: 2.2× on the double-substring query at the low end, 98.9× on the span_id lookup at the high end.
Section 3: Full-Text Search Syntax and SQL Compatibility
Text matching in ClickHouse depends on token functions that have to line up with how the text index was declared:
-- ClickHouse: text matching requires token functions
SELECT * FROM logs
WHERE hasAllTokens(lower(message), 'error', 'timeout')
LIMIT 100;
CtrlB expresses the same filter as standard SQL predicates and evaluates them directly, with no query transformation layer in between:
-- CtrlB: standard SQL, evaluated natively
SELECT * FROM logs
WHERE message LIKE '%error%' AND message LIKE '%timeout%'
LIMIT 100;
Section 4: Results Summary
Measured results from both suites, analytical search and full-text search, side by side:
Section 5: Conclusion
Measured across both suites, analytical search throughput and full-text search latency do not have to be traded against each other. One engine can hold both.
CtrlB takes #1 on the public ClickBench leaderboard at ×1.43 for analytical search and returns cold-cache full-text searches in double-digit milliseconds across 5 TB of telemetry. That covers the dashboard workload and the incident lookup workload from one system.
Check the Leaderboard Yourself
Both links open the public ClickBench leaderboard with the same 13 single-node Parquet systems preselected, one on each scoring metric. ClickBench rebuilds the board as engines submit new results, so live scores can move away from the figures recorded here.