Choosing to Drop the Vendor Workspace and Going Headless Instead
Every few weeks another "AI-native" observability tool shows up, promising to debug production for you: autonomous triage, agentic root-cause, and a polished demo to match. Look past the demo and most of them are doing the same thing. They wrap a language model around the same legacy database you already pay too much for.
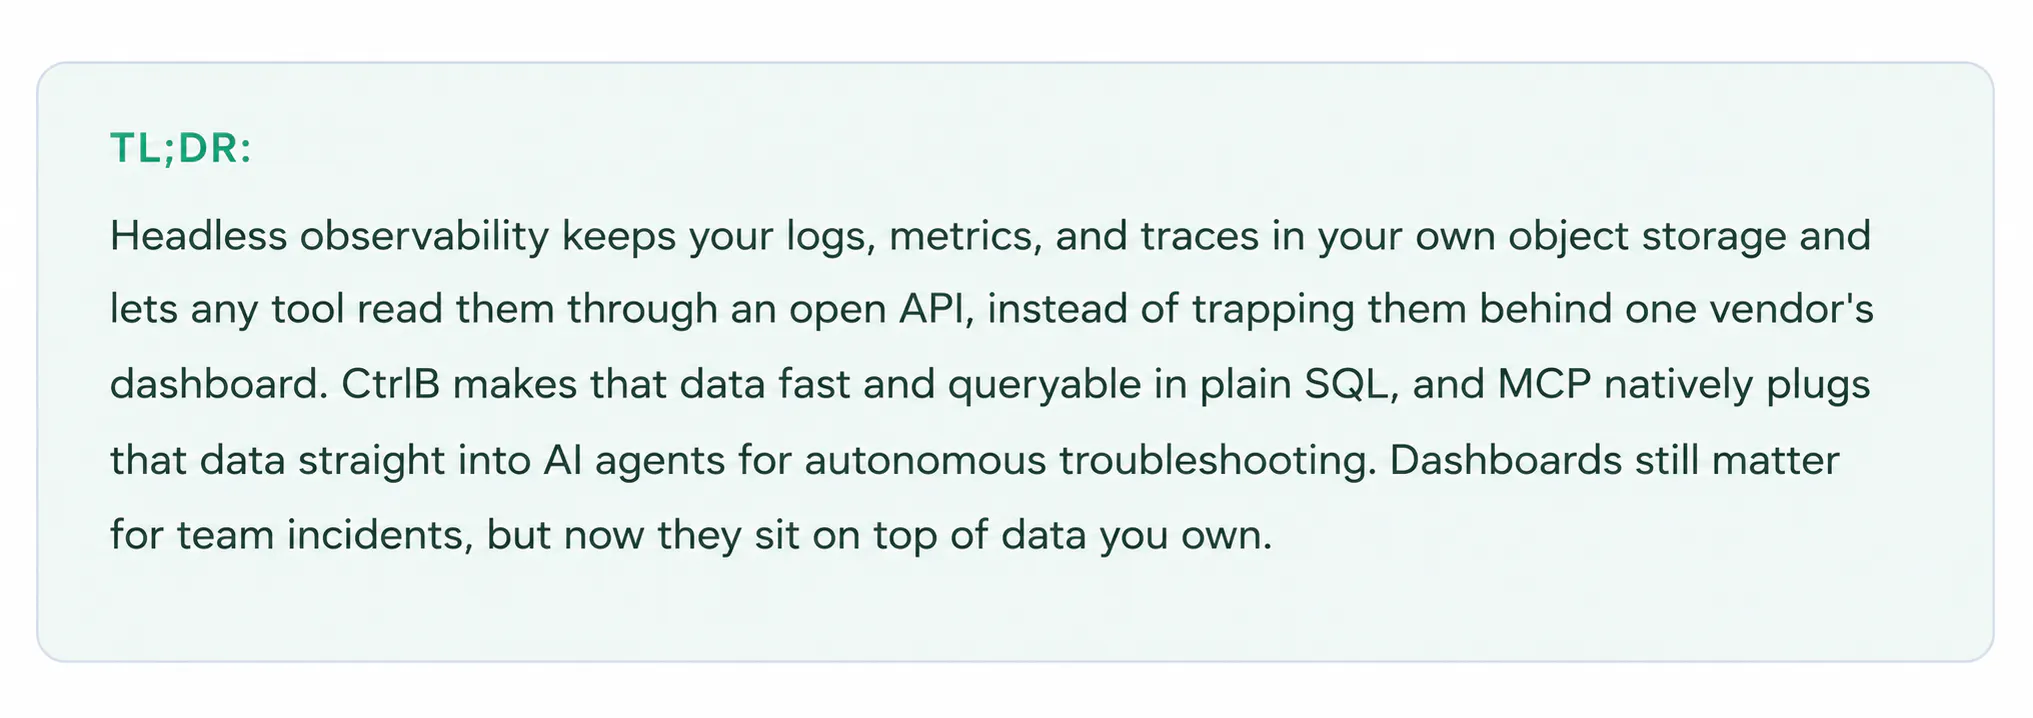
The model can be very good. The data underneath it is still slow, split across tools, and expensive to query. Headless observability is a direct answer to that: fix the data layer first, then let any tool sit on top of it. No amount of prompt engineering fixes a storage layer that was the problem in the first place.
An interface draped over a fragmented backend is still a fragmented architecture. The question is not whether your prompts are smart enough. It is whether the storage beneath them is broken.
01
What Is Headless Observability?
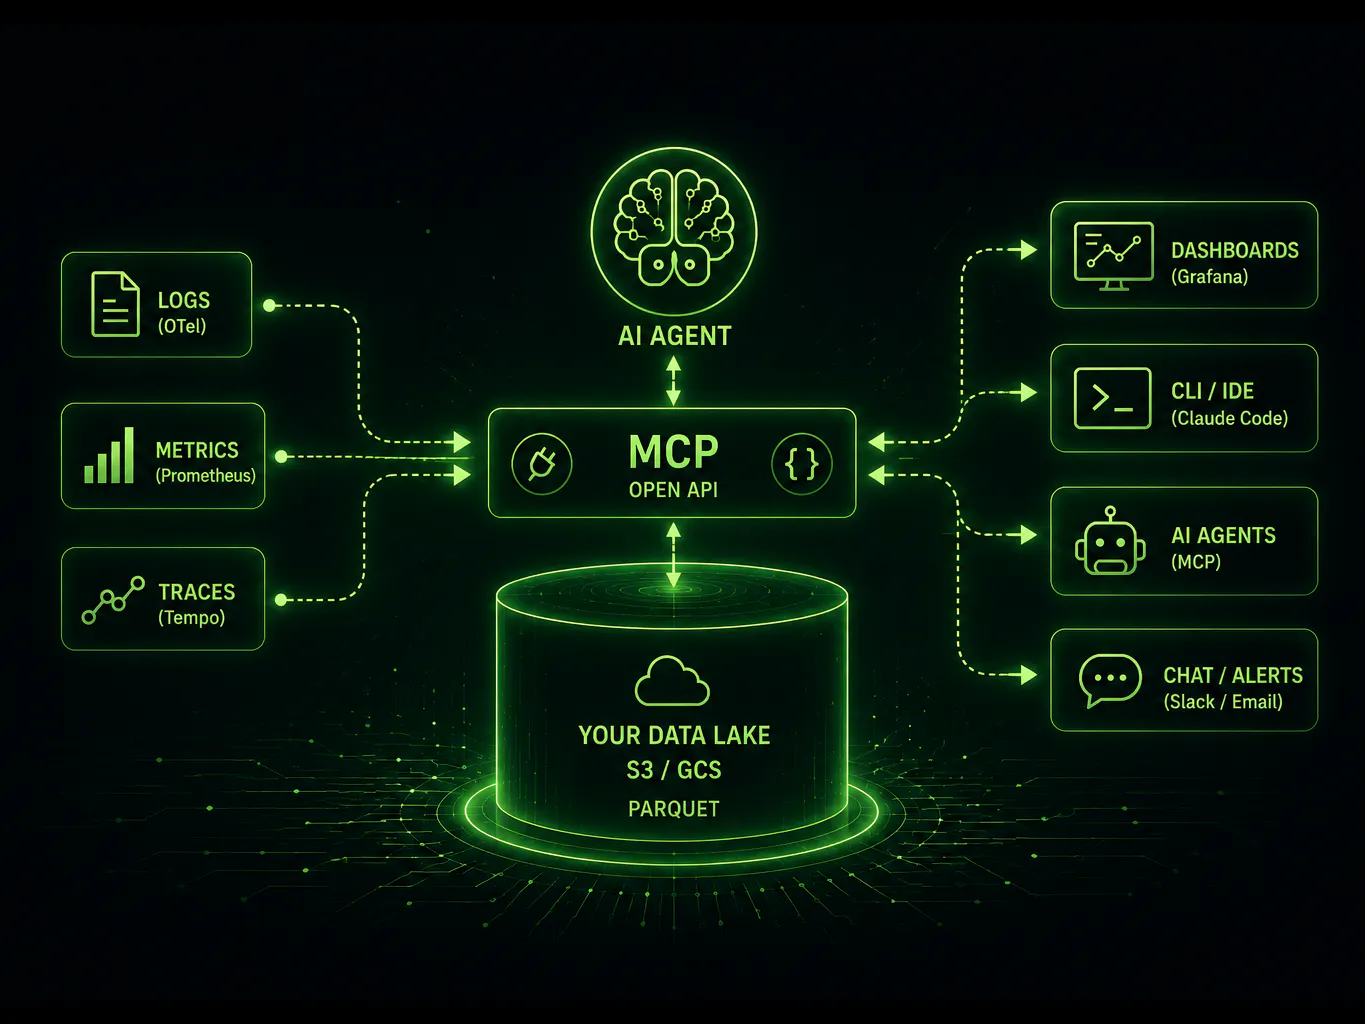
Headless observability decouples an observability platform's frontend, its visual dashboards and curated UIs, from the backend data storage that holds your telemetry. The frontend stops being welded to the data behind it.
Once the frontend is no longer the only way in, the data becomes something you can reach programmatically. AI agents, automated scripts, and CLI tools can read your logs, metrics, and traces directly through an open API, instead of clicking through a vendor's dashboard. This is the reason the Model Context Protocol (MCP) fits so naturally on top of a headless backend, and we will come back to it below.
In this model your telemetry stays in your own object storage, such as AWS S3 or GCS, in an open format like Parquet. The dashboard becomes one consumer among many rather than the gatekeeper for your data.
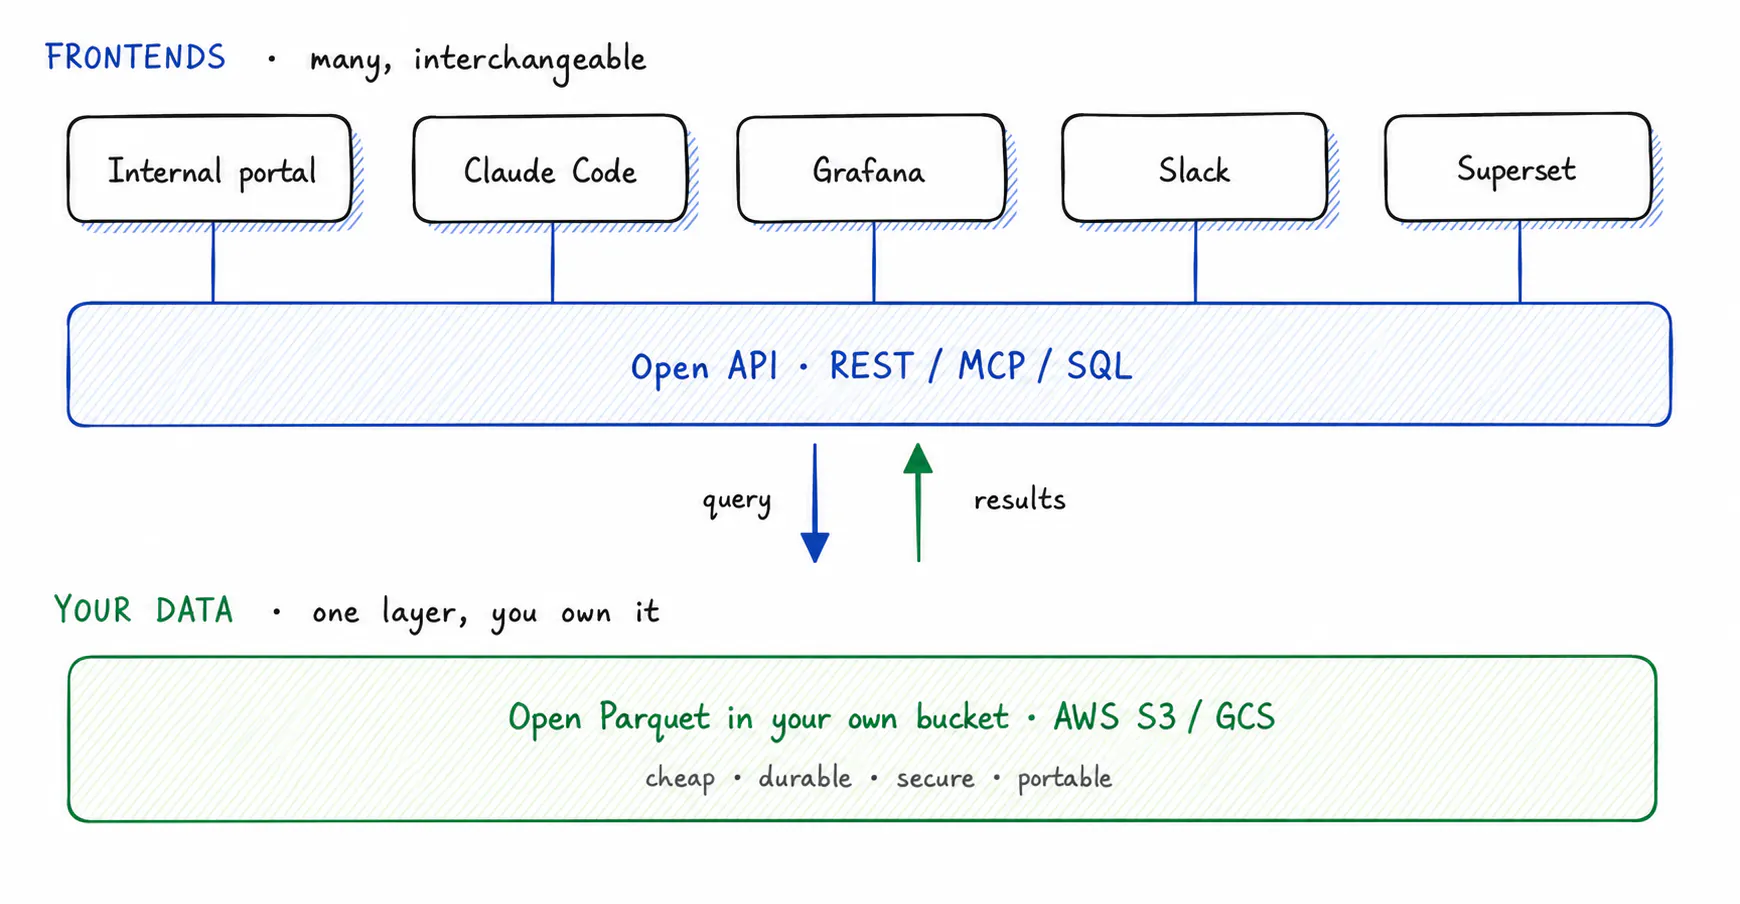
Fig 1. Two layers: many interchangeable frontends on top, one data layer you own underneath, joined by an open API that carries queries down and results back up.
Going headless does not mean throwing away your dashboards. It means dashboards stop being the mandatory workspace and become one tool among several. You can query from an internal portal, ask a terminal agent like Claude Code, or send results into a Slack thread. You open a dashboard when a dashboard is the right tool for the job, not because it is the only way to see your own data. Before we get to how you query that data, it helps to see exactly what the old, fragmented model costs you.
02
The Problem: Everyone Speaks a Different Language
Here is what fragmentation actually costs on a bad night. Your metrics live in one platform, your logs in another, and your traces in a third, and none of them are built to talk to each other. Each vendor ships its own query language, so building a single timeline means asking the same question several times, once per dialect, and translating it by hand.
None of these languages are wrong on their own. The problem is that there are six of them. Each is a separate product with its own syntax and its own quirks that you only remember at the worst moment. The cost is not only learning them. It is switching between them in the middle of an incident, while the clock runs, where every manual translation is a chance to put an error into your own investigation.
The same simple lookup, "find trace 4f2a9c in the last day," looks different in every tool:
# Splunk (SPL)
index=payments trace_id=4f2a9c earliest=-24h | head 1

# Grafana Loki (LogQL)
{service="payments"} | json | trace_id=`4f2a9c`

# Standard SQL
SELECT * FROM logs
WHERE trace_id = '4f2a9c'
  AND ts > now() - interval '24 hours';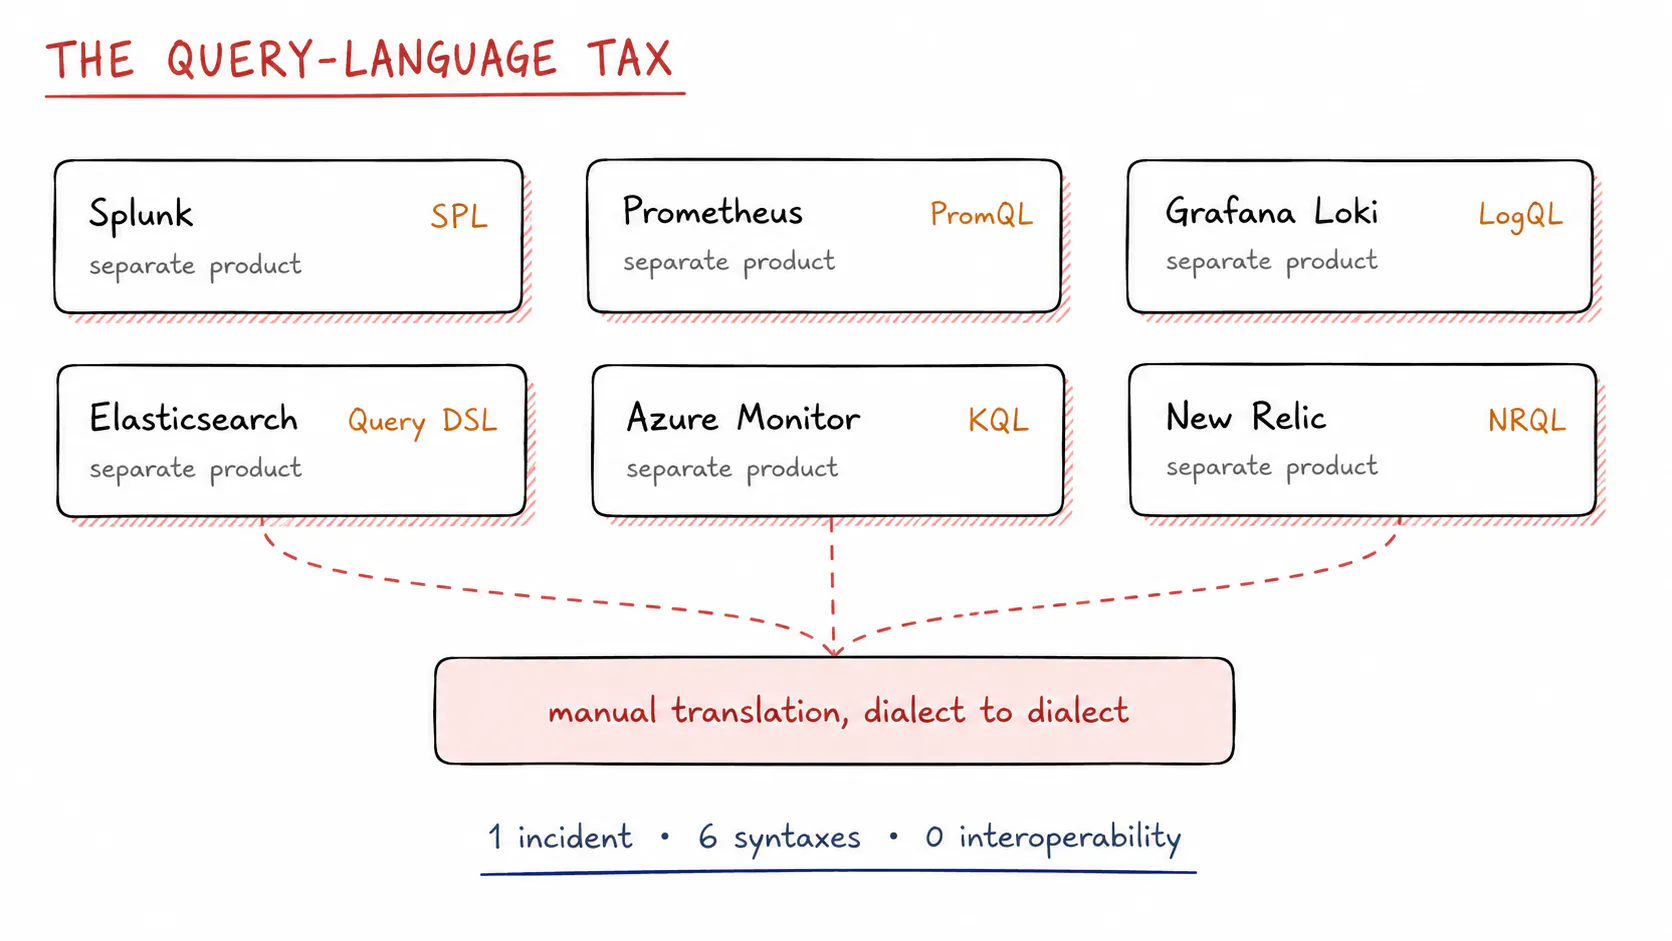
Fig 2. Six platforms, six query languages. Every cross-tool investigation pays a translation cost you did not choose.
03
The MCP Story: Handing the Keys to Your Agents
Humans are not the only ones paying the query-language tax. AI agents hit the same wall, and that is exactly where MCP comes in.
There is a common misconception that MCP is about how data is stored. It is not. MCP is an open standard, introduced by Anthropic, for connecting AI applications to external systems. It has nothing to do with your database or your buckets. It defines how an agent and a tool talk to each other.
In practice, an MCP server exposes a set of tools, for example a query tool for logs or a lookup for security alerts, along with the data resources behind them. The agent does not write your vendor's query language. It calls a tool with structured arguments, and the MCP server runs the actual query against the backend and returns the results. MCP itself does not learn anything, because it is a protocol, not a model. What it does is standardize the connection, so the model can act through well-defined tools instead of memorizing six proprietary syntaxes. It also helps enormously when the backend speaks one standard language instead of a bespoke dialect, because the model is far more reliable generating and refining what it sends. That is exactly what CtrlB does, which we turn to next.
Concretely, one natural-language question turns into a tool call, and the server turns that into SQL against your bucket:
# You ask, in plain English
"find the log trace where the payment gateway timed out last night"

# The agent calls an MCP tool with structured arguments
query_logs(service="payments", since="24h", contains="gateway timeout")

# The MCP server runs it as SQL against your bucket
SELECT * FROM logs
WHERE service = 'payments'
  AND message LIKE '%gateway timeout%'
  AND ts > now() - interval '24 hours';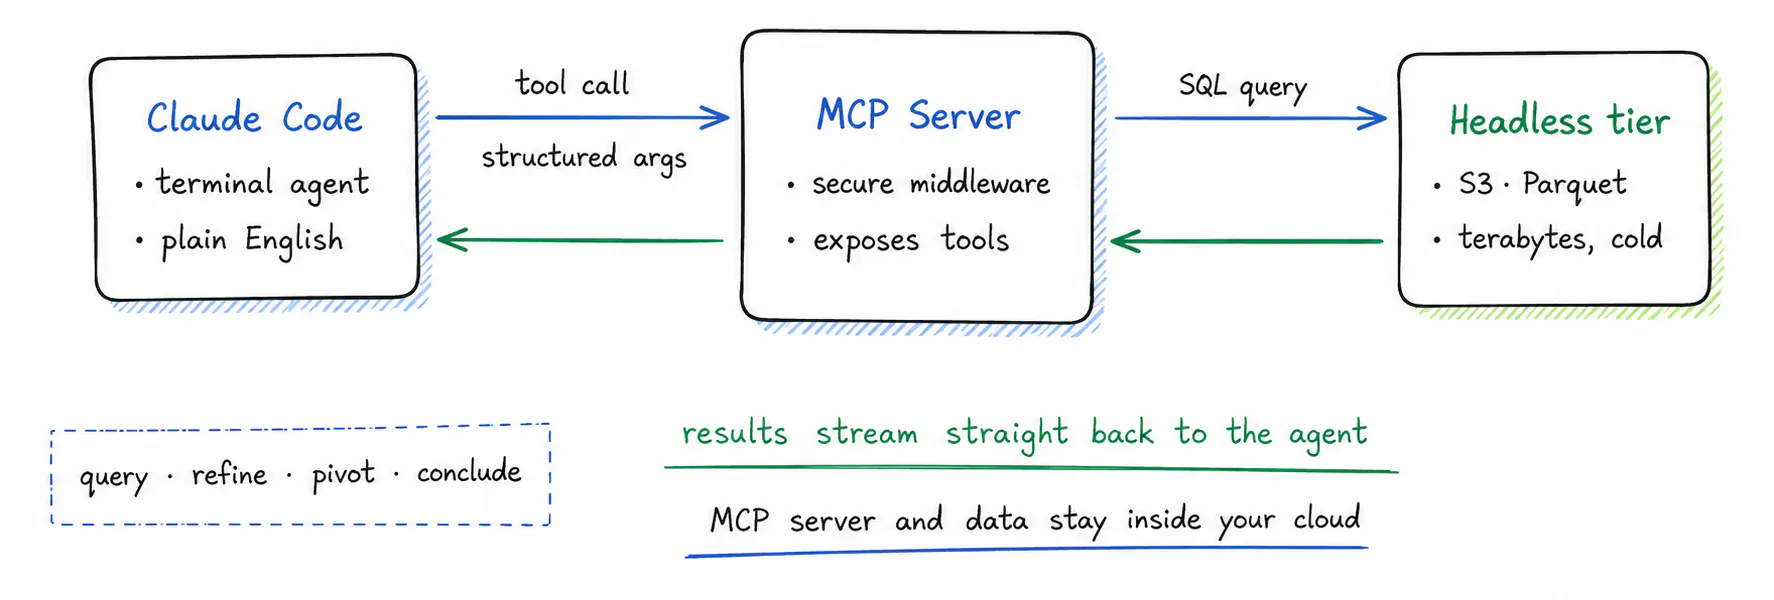
Fig 3. The agent calls a tool instead of writing SPL or PromQL. The MCP server runs it as SQL and streams results back, fast enough to iterate.
This is where a headless backend earns its place. Because it already exposes an open, high-speed API, an MCP server has a clean surface to build tools on. Ask a terminal agent like Claude Code a question in plain English, such as "find the log trace where the payment gateway timed out last night", and the agent picks the right tool, the server runs the query, and the telemetry comes straight back. Agents depend on iteration speed, the loop of query, refine, pivot, and conclude. When each lookup is fast, that loop holds together. When each lookup takes minutes, it falls apart.
04
One Engine, Plain SQL: The CtrlB Approach
A headless backend only delivers if it is genuinely fast. Making that work at petabyte scale is the hard part. If you leave raw telemetry sitting in plain S3 buckets, an ad-hoc text search turns into a full table scan that can run for hours. This is the problem CtrlB solves, and it does not do it by sitting on a separate lake. CtrlB turns your own object storage into a fast, queryable data lake. It writes your telemetry as columnar Parquet in your bucket and keeps lightweight indexes on the fields you actually search on, such as time, service, and trace_id, so a lookup jumps straight to the relevant files instead of scanning everything. You get warm query speed at object-storage cost, with less operational work rather than more.
It starts at ingestion, where fragmented pipelines cause most of the pain. Normally you run three separate agents to ship logs, metrics, and traces to three destinations, and then you maintain all three. CtrlB uses one. A single agent collects every telemetry stream at the source and writes them into your object storage together, with no fragmentation and no lost context.
The part that removes the query-language cost is straightforward. CtrlB uses standard SQL. There is no separate query language to learn and no vendor-specific syntax to memorize. Your engineers, your BI tools, and your data scientists already write SQL every day, and it works the same way across logs, metrics, and traces.
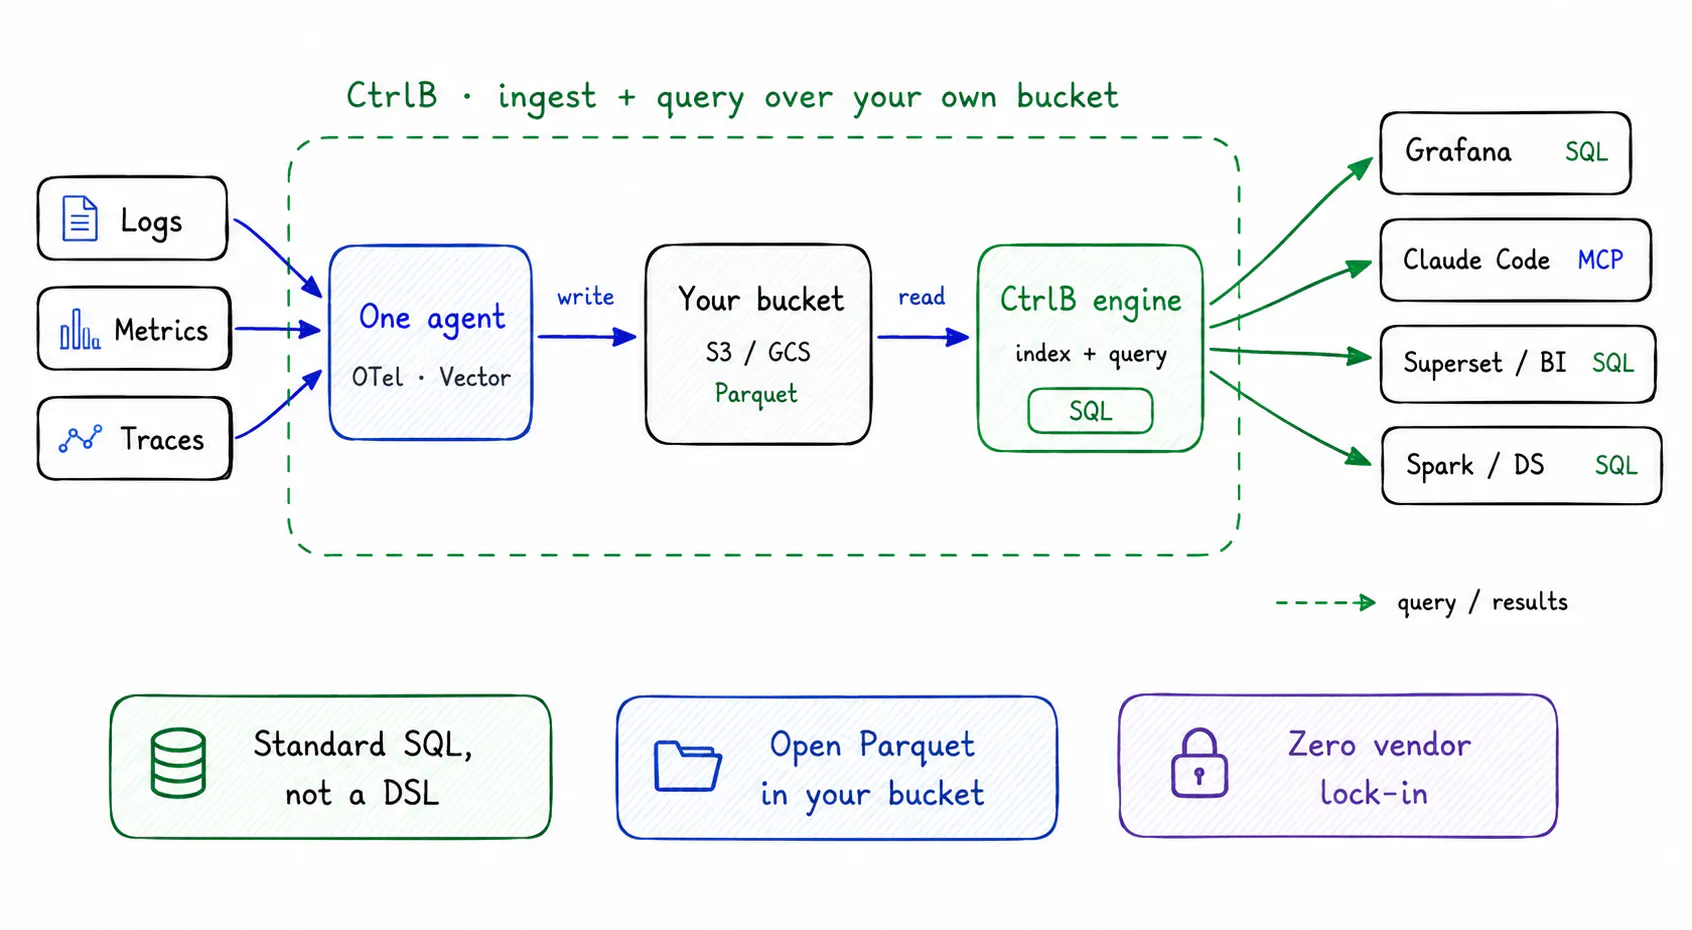
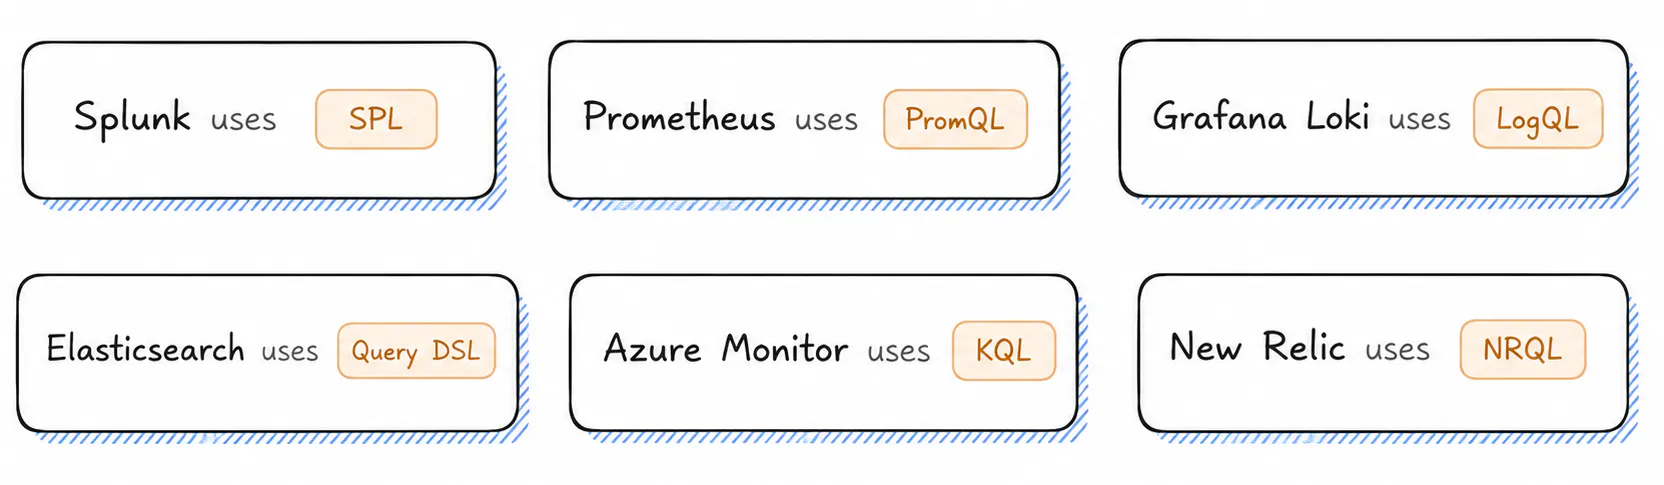
Fig 4. CtrlB writes your telemetry into your own bucket and queries it back. Every consumer reads the same data; dashboards and BI in SQL, agents through MCP.
Because every record is written to your own S3 or GCS buckets in open Parquet, there is no proprietary format to migrate off later. If you want to point an Apache Spark job, a data-science notebook, or a different analytics tool at the same bucket, you can. Your data stays yours.
05
Why Dashboards Still Matter
Headless systems and terminal agents work well for one person debugging alone. Most incidents are not solved alone.
When a Sev-1 hits at 2 a.m., a room of engineers, incident commanders, and product managers cannot work from raw JSON in a terminal. Resolving a team-wide failure still needs a shared, readable UI that everyone can follow at once, a common picture the whole room can point at.
Headless observability fixes the backend. It removes vendor lock-in, lowers ingestion cost, and exposes the open APIs your automation needs. Team resolution still needs a good frontend on top of that data. The difference is what sits underneath. You own the data now, and the dashboard becomes a layer you can change or replace, not a product that owns your telemetry.
See it on your own bucket
Point CtrlB at your S3 or GCS, keep your dashboards, and query everything in plain SQL.