In the landscape of log management solutions, the choices can seem endless, each with its own set of advantages and drawbacks. Among these options, self-hosted platforms like Elastic and Loki have gained significant traction, offering users control and customization over their logging infrastructure. However, in a world where cost is a crucial factor for businesses of all sizes, CtrlB emerges as a compelling alternative. As the most budget-friendly log management solution on the market, CtrlB promises to deliver powerful features without breaking the bank. In this blog, we'll delve into a comparative analysis, exploring the benefits and trade-offs of choosing CtrlB over self-hosted alternatives like Elastic and Loki, helping you make an informed decision for your logging needs.
TL;DR - key findings
- CtrlB is cheaper than most SaaS observability vendors in market.
- The total cost of ownership of ELK stack becomes much larger than using CtrlB because elastic stores data on SSDs whereas we store data on much cheaper S3.
- The total cost of ownership of Prometheus Loki Grafana stack is less than Elastic but a little higher than using CtrlB if you do not have a very lean DevOps team. Moreover we found out queries in Loki take much longer than us (thanks to our intelligent MPP based query engine).
- The ingestion performance of CtrlB is at par with Elastic and Loki. (Although Elastic is a bit slow because it indexes everything it ingests.)
- Storage used by CtrlB for the same amount of logs is about 1/4th of what ELK uses.
- Loki starts to fail on high volume / high cardinality data.
- Query performance: For an average daily use query, ELK takes milli-seconds, CtrlB has a sub-second latency, whereas Loki takes seconds to answer (assuming it doesn't fail).
Benchmarking Setup
We will be comparing CtrlB against self-hosted ELK (Elasticsearch, Loki and Kibana) stack and PLG (Promtail, Loki, and Grafana) stack.
Load generator
We generated fake logs using flog. It is a fake log generator for common log formats such as apache-common, apache-error, and RFC3164 syslog.
- Machine size: 3 machines each with: 8vCPUs, 16GB RAM
- Command:
docker run -it --rm mingrammer/flog -d 200µs -n 432000000This command generates around 5k logs per second for 24 hours. 3 such services are running, and after a day we have 1,296,000k log entries which take up 327GB in raw storage.
Deployment details
For a fair comparison, we deployed all the three platforms on VMs of same size - 32vCPUs, 64GB RAM which costs around $600 on AWS.
Benchmarking Results
To ensure the effectiveness of any log management tool, these three key factors hold utmost significance
Storage
As mentioned above, we produced at total of 327 GB of logs in a day which comprised of 1,296,000k log entries. This is the amount of storage each platform takes:
- CtrlB: 66.48 GB
- Elastic: 284.04 GB
- Loki: 79.8 GB
The large size of data in elastic is due to the massive indices elastic maintains to speed up log queries. CtrlB uses state of the art compression and we take up almost 1/4th of what elastic uses.
It is worthwhile to mention that we tried to query the total document count in all platforms. While CtrlB and ELK gave the correct answer -> 1,296,000k, the document count query failed in loki.
So CtrlB beats both Elastic and Loki in terms of storage efficiency.
Ingestion
Distributed cloud-native applications have the capacity to produce logs at an immense scale, so log management tools need to efficiently handle the ingestion of such large volumes of log data. We noticed the ingestion rate as:
- CtrlB: ~15.8k log entries per second
- Elastic: ~14.4k log entries per second
- Loki: ~15.1k log entries per second
So CtrlB is at par with Elastic and Loki in terms of ingestion. The slightly lower rate in Elastic can be attributed to the large amount of indexing and process elastic has to do on log data to support milli second query latency.
Query
The performance of queries across various logging solutions holds significant importance, aiding in the selection of a solution based on whether specific querying capabilities are necessary or not.
Query 1: Get all logs for last 5 minutes
- CtrlB: 0.55s
- Elastic: 0.163s
- Loki: 0.579s
Query 2: Get all logs for last 1 hour
- CtrlB: 0.69s
- Elastic: 0.175s
- Loki: 0.670s
Query 3: Get all logs for last 1 hour where body contains some string
- CtrlB: 0.30s
- Elastic: 0.174s
- Loki: 3.29s
Query 4: Get all logs for last 1 hour where a log field equals some particular value
- CtrlB: 0.62s
- Elastic: 0.227s
- Loki: fails
We will also highlight the fact that Loki fails to get the count of logs for the above queries, again highlighting the fact that it has trouble dealing with a lot of data, whereas CtrlB and Elastic successfully returned the correct document count.
This data tells us that Elastic stack takes milli seconds to answer what CtrlB does in less than a second and Loki does in a few seconds (given it doesn't fail). This could be attributed to the massive amount of indexing in elastic and the fact that it stores data on costly SSD whereas CtrlB and Loki store data on cheap s3 storage.
Total Cost of Ownership comparison
The above experiment produced 327GB of logs in 24 hours or 10TB data in a month. Let's also assume the following:
- The data needs to be retained for 30 days.
- 3x replication is needed for ELK stack to reliability.
- 2 DevOps engineers are needed to handle the self-hosted infra and 1 DevOps engineer earns around $1000 per month in India.
This table details the total cost a company would pay to manage this data on different logging platforms:
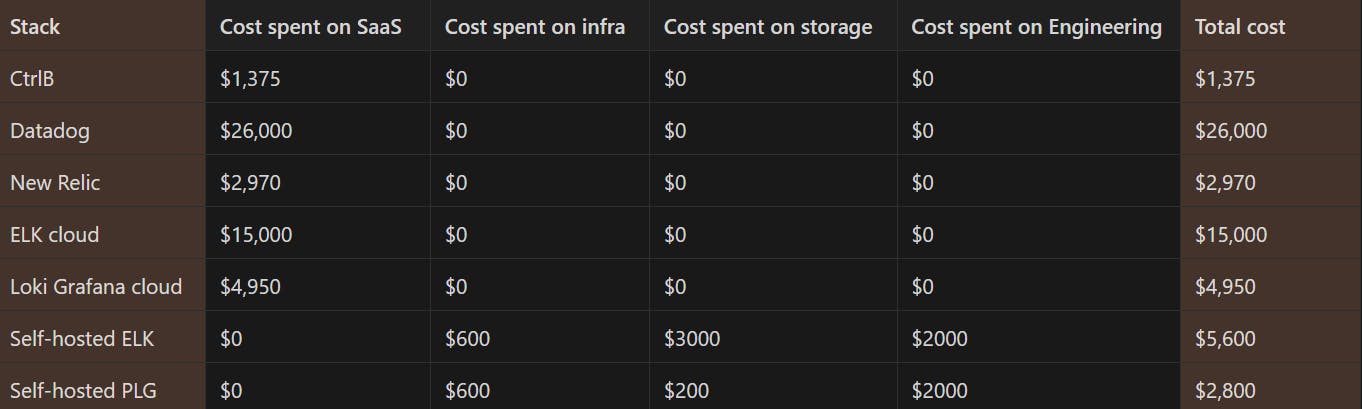
TCO comparison
In this table we note:
- CtrlB is cheaper than most SaaS players in observability market.
- The storage in self-hosted Elastic is the costliest element in its TCO.
Conclusion: When should you prefer CtrlB over self-hosted solutions?
- In this blog we have seen that CtrlB is as performant as Elastic or Loki stacks in terms of ingestion, querying and storage.
- We realized that self-hosting elastic can become expensive quickly because of the costly SSD storage.
- The storage in Loki is cheap but it offers poor query performance and starts having issues when faced with high volume and high cardinality.
So in summary, if you're someone who is:
- Pissed with your observability bills and looking for a cheap log management solution with sub-second latency.
- Do not want the overheads of having to maintain a self-hosted solution yourself.
Feel free to reach out to us at support@ctrlb.ai, and we promise to slash your observability bills.