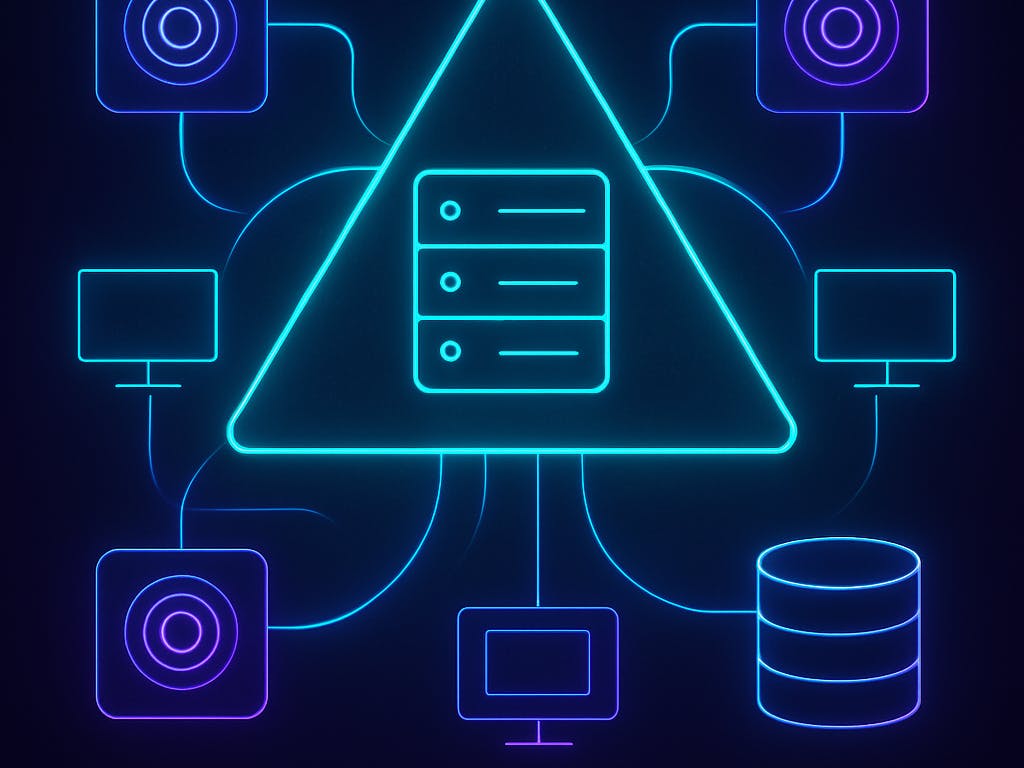
When teams transitioned from monoliths to microservices, debugging didn’t become easier; it became messier. Every service now generates its own logs. However, when a single user request traverses six different services across various containers or clusters, those logs do not naturally connect. You find yourself jumping between files, dashboards, and guesswork.
In this environment, logs are necessary but insufficient. What you need is context. That’s where distributed tracing comes into play. With OpenTelemetry (OTEL) and CtrlB, that context is no longer out of reach
Why Logging in Microservices Is Hard
Logs are supposed to help us understand what went wrong. But in microservices, they often leave us with more questions than answers:
- Services talk to each other, but their logs don’t.
- You can’t follow a request across services easily.
- You end up with thousands of log lines but no real signal.
- Correlating logs by timestamp or request ID is slow and often unreliable
- Traditional log management tools weren't built for this scale or this complexity.
In short, logs are fragmented, and that makes root cause analysis slow, messy, and frustrating!
Distributed Tracing: The Missing Link Between Logs
A trace is the full journey of a request. It shows where the request started, which services it touched, how long each step took, and where things slowed down or failed.
Each step in that journey is a span: a timestamped unit of work inside a service.
- Traces give you the structure: which services were involved, how long each step took, and where the bottlenecks were.
- Logs give you the details: what exactly was happening inside the service during that span.
Without tracing, logs are just isolated fragments. But together, logs + traces tell the full story.
OpenTelemetry (OTEL): The Backbone of Context
So, how do you link logs and traces?
That’s where OpenTelemetry (OTEL) helps. It’s an open-source, vendor-neutral standard for telemetry data.
OTEL helps your services emit consistent metadata, like trace IDs and span IDs, so logs and traces can be tied together.
- It auto-generates trace and span IDs.
- It injects those into HTTP headers and logs.
- It supports many frameworks and languages out of the box.
- It keeps you from getting locked into a specific vendor.
Once your services are instrumented with OTEL, every log line can carry trace metadata, and your traces can act as high-level maps to all the related logs.
CtrlB + OTEL: A Powerful Combo for Microservices Teams
Now that you have logs and traces, how do you use them effectively? That’s where CtrlB steps in. CtrlB ingests both your logs and OTEL spans and connects them. You can:
- Click on any slow span → instantly see logs across services from the same time window.
- Search logs or trace metadata, no manual correlation needed.
- Investigate exemplars of slow or failed requests and drill into their logs directly.
CtrlB reads your logs directly from object storage like S3 and performs on-demand search and matching, so you get both cost-efficiency and speed.
Live Debugging with CtrlB: No Redeploys Required
Once you've found the issue, how do you confirm it, without restarting or redeploying? That’s where CtrlB Debug comes in, an IDE plugin that brings live instrumentation into your workflow.
- You can add tracepoints (non-breaking breakpoints) or dynamic log lines in running code, without stopping or redeploying it.
- CtrlB supports OTEL-based dynamic instrumentation, which means you can add traces at runtime.
- You can inspect variables inside the function that handled the failing request.
This turns observability from a passive monitor into an active investigation tool.
A Real-World Example: Checkout Flow Debugging
A customer reports that the checkout is slow. You open CtrlB Explore and pull up traces from around the time of the issue. One trace pops up, the checkout-service span took 8 seconds. You click it. CtrlB automatically pulls in related logs from checkout, payment, and cart services, all linked to that one trace. In the logs, you spot something odd: a retry loop in the payment-service running too many times.
You jump to your IDE, open the CtrlB plugin, and drop a live tracepoint in the retry block, no redeploy needed. The tracepoint reveals the root cause: a config error is causing unnecessary retries. You fix it. Push the change. And just like that, checkout is fast again.
From Logs to Fix, Without Leaving Flow
This is the power of using logs, traces, and live debugging as a single workflow:
- CtrlB Explore helps you find the problem.
- CtrlB Debug helps you prove and fix it.
- Both work together to reduce friction, context-switching, and guesswork.
Final Thoughts: Microservices Deserve Better Logging
Logs are still essential, but in microservices, they aren’t enough. You need correlation. You need context. You need tools that go beyond monitoring: tools that help you investigate, give you the ability to see the full journey of a request, confirm, and fix.
With OpenTelemetry and CtrlB, you get all of that. Trace the issue. Inspect the logs. Drop a live tracepoint. Fix it on the spot.
Take control of your observability
Join thousands of developers using CtrlB to monitor their systems with complete confidence and extreme precision.
Seamless Integration
Connect your entire stack in minutes with zero friction.
Real-time Analytics
Sub-second latency on all queries. No waiting.
Enterprise Grade
SOC2 Type II compliant, secure, and highly available.
